Chart"
From Documentation
| Line 169: | Line 169: | ||
! Version !! Date !! Content | ! Version !! Date !! Content | ||
|- | |- | ||
| − | | | + | | 5.0.3 |
| − | + | | June 2010 | |
| − | + | | The area sent with the click event becomes UUID of the area component. Thus, use <tt>desktop.getComponentByUuid(event.getArea())</tt>. To write a program compatible with any version of ZK: | |
| + | <source lang="java"> | ||
| + | String areaid = event.getArea(); | ||
| + | if (areaid != null) { | ||
| + | Area area = desktop.getComponentByUuidIfAny(areaid); | ||
| + | if (area == null) | ||
| + | area = chart.getFellow(areaid); //fall back to older version | ||
| + | ... | ||
| + | </source> | ||
|} | |} | ||
{{ZKComponentReferencePageFooter}} | {{ZKComponentReferencePageFooter}} | ||
Revision as of 10:23, 11 August 2010
Chart
Employment/Purpose
A chart is used to show a set of data as a graph. It helps users to judge things with a snapshot. To use a chart component , developers must prepare a ChartModel and a ChartEngine. Developers also set proper chart type, and the threeD (3D) attribute to draw proper chart. The model and type must match to each other; or the result is unpredictable. The 3D chart is not supported on all chart type.
Example
| PieModel | ||
| PieModel | ||
| CategoryModel | ||
| CategoryModel or XYModel | ||
| CategoryModel or XYModel | ||
| CategoryModel | ||
| CategoryModel or XYModel | ||
| CategoryModel | ||
| XYModel | ||
| XYModel | ||
| XYModel | ||
| XYModel | ||
| XYModel | ||
| XYModel | ||
| XYModel | ||
| HiLoModel | ||
| HiLoModel |
<vbox>
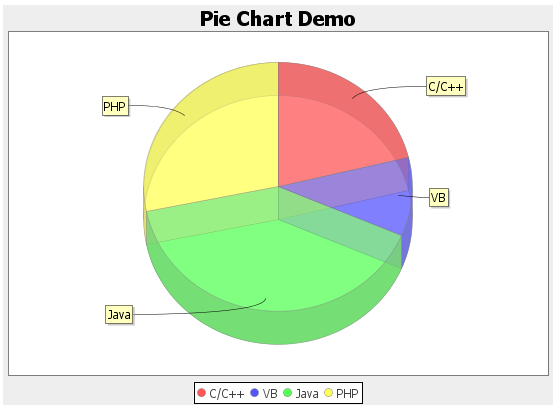
     <chart id="mychart" title="Pie Chart Demo" width="500" height="250" type="pie" threeD="true" fgAlpha="128"/>
     <zscript>
         PieModel model = new MyPieModel();
         mychart.setModel(model);
     </zscript>
 </vbox>
Supported events
| MouseEvent
Use getX(), getY() method to get coordinates. Use getArea() method to get the UUID of the area component which user clicks on. void drilldown(MouseEvent event) {
final String areaid = event.getArea();
if (areaid != null) {
Area area = (Area)desktop.getComponentByUuid()
Messagebox.show(area.getAttribute("entity")+": "+area.getTooltiptext());
}
}
|
Supported Children
*NONE
Use cases
| Version | Description | Example Location |
|---|---|---|
| 5.0 | Make a Chart fill 100% width in parent panel | http://www.zkoss.org/forum/listComment/10761 |
| 5.0 | Dual axis in Chart | http://www.zkoss.org/forum/listComment/8752 |
Version History
| Version | Date | Content |
|---|---|---|
| 5.0.3 | June 2010 | The area sent with the click event becomes UUID of the area component. Thus, use desktop.getComponentByUuid(event.getArea()). To write a program compatible with any version of ZK:
String areaid = event.getArea();
if (areaid != null) {
  Area area = desktop.getComponentByUuidIfAny(areaid);
  if (area == null)
    area = chart.getFellow(areaid); //fall back to older version
...
|
