Exporting"
(→Size) |
|||
| Line 1: | Line 1: | ||
| − | = | + | = Exporting Images = |
== Size == | == Size == | ||
The exported image size in pixel is calculated by: | The exported image size in pixel is calculated by: | ||
| − | ''chart width'' | + | ''chart width'' x ''scale'' = exported width |
| − | ''chart height'' | + | ''chart height'' x ''scale'' = exported height |
If you do not specify a chart's width and height, ZK Charts exports with the default size: | If you do not specify a chart's width and height, ZK Charts exports with the default size: | ||
| Line 12: | Line 12: | ||
* height, '''400 pixels''' | * height, '''400 pixels''' | ||
| − | Because of [https://api.highcharts.com/highcharts/exporting.scale the default scale] is '''2''', the exported image will be 1200 pixels (width) | + | Because of [https://api.highcharts.com/highcharts/exporting.scale the default scale] is '''2''', the exported image will be 1200 pixels (width) x 800 pixels (height). |
| Line 30: | Line 30: | ||
Differences: | Differences: | ||
# All x-axis labels are rotated. | # All x-axis labels are rotated. | ||
| − | # | + | # The y-axis tick interval changes. |
| − | The differences are caused by the different size between exporting and on-screen one. | + | The differences are caused by the different size between exporting (600 x 400) and on-screen one (1,540 × 286). Because ZK Chart will auto adjust axis tick label according to the width/height, so |
| + | # All x-axis labels are rotated because the exported chart is narrower. | ||
| + | # The y-axis tick interval changes because the exported chart is shorter. ZK Charts automatically removes some axis labels [https://api.highcharts.com/highcharts/yAxis.tickInterval if they are too dense to be drawn]. | ||
| + | |||
| + | To avoid such image difference generated by auto calculation upon size, you may specify explicit chart options like setting y-axis tick interval: | ||
| + | <source lang='java'> | ||
| + | chart.getYAxis().setTickInterval(10); | ||
| + | </source> | ||
Revision as of 09:03, 8 December 2017
Exporting Images
Size
The exported image size in pixel is calculated by:
chart width x scale = exported width
chart height x scale = exported height
If you do not specify a chart's width and height, ZK Charts exports with the default size:
- width, 600 pixels
- height, 400 pixels
Because of the default scale is 2, the exported image will be 1200 pixels (width) x 800 pixels (height).
If you specify a chart's width/height (or hfle/vflex), e.g. 400 pixels wide and 200 pixels high, then exported image will be 800 pixels wide and 400 pixels high.
Difference between a Chart on Screen and Exported One
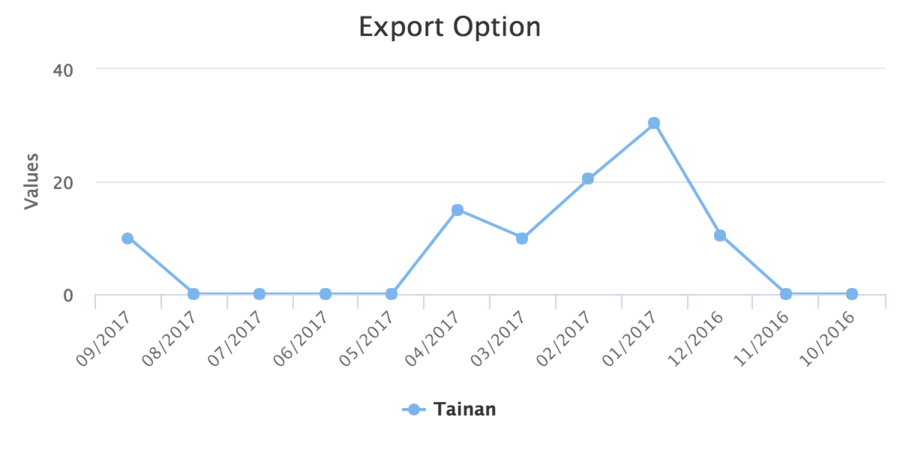
Because the exported size might be different from the chart's size on your screen, so the exported chart image might look different from your screen.
For example, the original chart on the screen:
The exported result:
Differences:
- All x-axis labels are rotated.
- The y-axis tick interval changes.
The differences are caused by the different size between exporting (600 x 400) and on-screen one (1,540 × 286). Because ZK Chart will auto adjust axis tick label according to the width/height, so
- All x-axis labels are rotated because the exported chart is narrower.
- The y-axis tick interval changes because the exported chart is shorter. ZK Charts automatically removes some axis labels if they are too dense to be drawn.
To avoid such image difference generated by auto calculation upon size, you may specify explicit chart options like setting y-axis tick interval:
chart.getYAxis().setTickInterval(10);

