ZK Charts"
m (moved Small Talks/ZK Charts to Small Talks/2009/March/ZK Charts) |
m (correct highlight (via JWB)) |
||
| (One intermediate revision by one other user not shown) | |||
| Line 10: | Line 10: | ||
You can find the latest source code of the examples at this address: [http://www.zkoss.org/zkdemo/userguide/data/morechart.zul] | You can find the latest source code of the examples at this address: [http://www.zkoss.org/zkdemo/userguide/data/morechart.zul] | ||
| − | To use a chart component , developers must prepare a < | + | To use a chart component , developers must prepare a <code>ChartModel </code>and a <code>ChartEngine.</code> Developers also set proper chart type, and the threeD (3D) attribute to draw proper chart. The model and type must fit together, or the result is unpredictable. The 3D chart is not supported on all chart type. |
=== available chart types === | === available chart types === | ||
| Line 19: | Line 19: | ||
|- | |- | ||
| − | | <center>< | + | | <center><code>pie</code></center> |
| − | | < | + | | <code>PieModel</code> |
| − | | <center>< | + | | <center><code>o</code></center> |
|- | |- | ||
| − | | <center>< | + | | <center><code>ring</code></center> |
| − | | < | + | | <code>PieModel</code> |
| − | | <center>< | + | | <center><code>x</code></center> |
|- | |- | ||
| − | | <center>< | + | | <center><code>bar</code></center> |
| − | | < | + | | <code>CategoryModel</code> |
| − | | <center>< | + | | <center><code>o</code></center> |
|- | |- | ||
| − | | <center>< | + | | <center><code>line</code></center> |
| − | | < | + | | <code>CategoryModel </code>or<code> XYModel</code> |
| − | | <center>< | + | | <center><code>o</code></center> |
|- | |- | ||
| − | | <center>< | + | | <center><code>area</code></center> |
| − | | < | + | | <code>CategoryModel </code>or<code> XYModel</code> |
| − | | <center>< | + | | <center><code>x</code></center> |
|- | |- | ||
| − | | <center>< | + | | <center><code>stacked_bar </code></center> |
| − | | < | + | | <code>CategoryModel</code> |
| − | | <center>< | + | | <center><code>o</code></center> |
|- | |- | ||
| − | | <center>< | + | | <center><code>stacked_area </code></center> |
| − | | < | + | | <code>CategoryModel </code>or<code> XYModel</code> |
| − | | <center>< | + | | <center><code>x</code></center> |
|- | |- | ||
| − | | <center>< | + | | <center><code>waterfall </code></center> |
| − | | < | + | | <code>CategoryModel</code> |
| − | | <center>< | + | | <center><code>x</code></center> |
|- | |- | ||
| − | | <center>< | + | | <center><code>polar </code></center> |
| − | | < | + | | <code>XYModel</code> |
| <center>x</center> | | <center>x</center> | ||
|- | |- | ||
| − | | <center>< | + | | <center><code>scatter </code></center> |
| − | | < | + | | <code>XYModel</code> |
| <center>x</center> | | <center>x</center> | ||
|- | |- | ||
| − | | <center>< | + | | <center><code>time_series </code></center> |
| − | | < | + | | <code>XYModel</code> |
| <center>x</center> | | <center>x</center> | ||
|- | |- | ||
| − | | <center>< | + | | <center><code>polar </code></center> |
| − | | < | + | | <code>XYModel</code> |
| <center>x</center> | | <center>x</center> | ||
|- | |- | ||
| − | | <center>< | + | | <center><code>step_area </code></center> |
| − | | < | + | | <code>XYModel</code> |
| <center>x</center> | | <center>x</center> | ||
|- | |- | ||
| − | | <center>< | + | | <center><code>step </code></center> |
| − | | < | + | | <code>XYModel</code> |
| <center>x</center> | | <center>x</center> | ||
|- | |- | ||
| − | | <center>< | + | | <center><code>histogram </code></center> |
| − | | < | + | | <code>XYModel</code> |
| <center>x</center> | | <center>x</center> | ||
|- | |- | ||
| − | | <center>< | + | | <center><code>candlestick </code></center> |
| − | | < | + | | <code>HiLoModel</code> |
| <center>x</center> | | <center>x</center> | ||
|- | |- | ||
| − | | <center>< | + | | <center><code>hilow</code></center> |
| − | | < | + | | <code>HiLoModel</code> |
| <center>x</center> | | <center>x</center> | ||
|- | |- | ||
| − | | <center>< | + | | <center><code>XYZ </code></center> |
| − | | < | + | | <code>XYZModel</code> |
| <center>x</center> | | <center>x</center> | ||
|- | |- | ||
| − | | <center>< | + | | <center><code>wafer</code></center> |
| − | | < | + | | <code>wafermodel</code> |
| <center>x</center> | | <center>x</center> | ||
|- | |- | ||
| − | | <center>< | + | | <center><code>gantt</code></center> |
| − | | < | + | | <code>ganttmodel</code> |
| <center>x</center> | | <center>x</center> | ||
|- | |- | ||
| − | | <center>< | + | | <center><code>wind</code></center> |
| − | | < | + | | <code>windmodel</code> |
| <center>x</center> | | <center>x</center> | ||
| Line 145: | Line 145: | ||
|- | |- | ||
| − | | <center>< | + | | <center><code>pie</code></center> |
| − | | < | + | | <code>PieModel</code> |
| − | | <center>< | + | | <center><code>o</code></center> |
|- | |- | ||
| − | | <center>< | + | | <center><code>ring</code></center> |
| − | | < | + | | <code>PieModel</code> |
| − | | <center>< | + | | <center><code>x</code></center> |
|} | |} | ||
| Line 184: | Line 184: | ||
|- | |- | ||
| − | | <center>< | + | | <center><code>bar</code></center> |
| − | | < | + | | <code>CategoryModel</code> |
| − | | <center>< | + | | <center><code>o</code></center> |
|- | |- | ||
| − | | <center>< | + | | <center><code>line</code></center> |
| − | | < | + | | <code>CategoryModel </code>or<code> XYModel</code> |
| − | | <center>< | + | | <center><code>o</code></center> |
|- | |- | ||
| − | | <center>< | + | | <center><code>area</code></center> |
| − | | < | + | | <code>CategoryModel </code>or<code> XYModel</code> |
| − | | <center>< | + | | <center><code>x</code></center> |
|- | |- | ||
| − | | <center>< | + | | <center><code>stacked_bar </code></center> |
| − | | < | + | | <code>CategoryModel</code> |
| − | | <center>< | + | | <center><code>o</code></center> |
|- | |- | ||
| − | | <center>< | + | | <center><code>stacked_area </code></center> |
| − | | < | + | | <code>CategoryModel </code>or<code> XYModel</code> |
| − | | <center>< | + | | <center><code>x</code></center> |
|- | |- | ||
| − | | <center>< | + | | <center><code>waterfall </code></center> |
| − | | < | + | | <code>CategoryModel</code> |
| − | | <center>< | + | | <center><code>x</code></center> |
|} | |} | ||
| Line 248: | Line 248: | ||
|- | |- | ||
| − | | <center>< | + | | <center><code>line</code></center> |
| − | | < | + | | <code>CategoryModel </code>or<code> XYModel</code> |
| − | | <center>< | + | | <center><code>o</code></center> |
|- | |- | ||
| − | | <center>< | + | | <center><code>area</code></center> |
| − | | < | + | | <code>CategoryModel </code>or<code> XYModel</code> |
| − | | <center>< | + | | <center><code>x</code></center> |
|- | |- | ||
| − | | <center>< | + | | <center><code>stacked_area </code></center> |
| − | | < | + | | <code>CategoryModel </code>or<code> XYModel</code> |
| − | | <center>< | + | | <center><code>x</code></center> |
|- | |- | ||
| − | | <center>< | + | | <center><code>polar </code></center> |
| − | | < | + | | <code>XYModel</code> |
| <center>x</center> | | <center>x</center> | ||
|- | |- | ||
| − | | <center>< | + | | <center><code>scatter </code></center> |
| − | | < | + | | <code>XYModel</code> |
| <center>x</center> | | <center>x</center> | ||
|- | |- | ||
| − | | <center>< | + | | <center><code>time_series </code></center> |
| − | | < | + | | <code>XYModel</code> |
| <center>x</center> | | <center>x</center> | ||
|- | |- | ||
| − | | <center>< | + | | <center><code>polar </code></center> |
| − | | < | + | | <code>XYModel</code> |
| <center>x</center> | | <center>x</center> | ||
|- | |- | ||
| − | | <center>< | + | | <center><code>step_area </code></center> |
| − | | < | + | | <code>XYModel</code> |
| <center>x</center> | | <center>x</center> | ||
|- | |- | ||
| − | | <center>< | + | | <center><code>step </code></center> |
| − | | < | + | | <code>XYModel</code> |
| <center>x</center> | | <center>x</center> | ||
|- | |- | ||
| − | | <center>< | + | | <center><code>histogram </code></center> |
| − | | < | + | | <code>XYModel</code> |
| <center>x</center> | | <center>x</center> | ||
| Line 359: | Line 359: | ||
|- | |- | ||
| − | | <center>< | + | | <center><code>candlestick </code></center> |
| − | | < | + | | <code>HiLoModel</code> |
| <center>x</center> | | <center>x</center> | ||
|- | |- | ||
| − | | <center>< | + | | <center><code>hilow</code></center> |
| − | | < | + | | <code>HiLoModel</code> |
| <center>x</center> | | <center>x</center> | ||
| Line 478: | Line 478: | ||
<source lang="xml"> | <source lang="xml"> | ||
| − | < | + | <chart id="gantt" title="Gantt Chart" width="700" height="400" |
| − | <zscript><![CDATA[ | + | type="gantt" threeD="false" fgAlpha="128" dateFormat="yyyy/MM/dd" > |
| − | import org.zkoss.zul.GanttModel.GanttTask; | + | <zscript><![CDATA[ |
| − | + | import org.zkoss.zul.GanttModel.GanttTask; | |
| − | //series, task (task description, start, end, complete percentage) | + | |
| − | GanttModel ganttmodel = new GanttModel(); | + | public Date date(int year, int month, int day) { |
| − | ganttmodel.addValue("Scheduled", new GanttTask("Write Proposal", date(2008,4,1), date(2008,4,5), 0.0)); | + | final java.util.Calendar calendar = java.util.Calendar.getInstance(); |
| − | ganttmodel.addValue("Scheduled", new GanttTask("Obtain Approval", date(2008,4,9), date(2008,4,9), 0.0)); | + | calendar.set(year, month-1, day); |
| − | ganttmodel.addValue("Scheduled", new GanttTask("Requirements Analysis", date(2008,4,10), date(2008,5,5), 0.0)); | + | final Date result = calendar.getTime(); |
| − | ganttmodel.addValue("Scheduled", new GanttTask("Design Phase", date(2008,5,6), date(2008,5,30), 0.0)); | + | return result; |
| − | ganttmodel.addValue("Scheduled", new GanttTask("Design Signoff", date(2008,6,2), date(2008,6,2), 0.0)); | + | } |
| − | ganttmodel.addValue("Scheduled", new GanttTask("Alpha Implementation", date(2008,6,3), date(2008,7,31), 0.0)); | + | //series, task (task description, start, end, complete percentage) |
| − | ganttmodel.addValue("Scheduled", new GanttTask("Design Review", date(2008,8,1), date(2008,8,8), 0.0)); | + | GanttModel ganttmodel = new GanttModel(); |
| − | ganttmodel.addValue("Scheduled", new GanttTask("Revised Design Signoff", date(2008,8,10), date(2008,8,10), 0.0)); | + | ganttmodel.addValue("Scheduled", new GanttTask("Write Proposal", date(2008,4,1), date(2008,4,5), 0.0)); |
| − | ganttmodel.addValue("Scheduled", new GanttTask("Beta Implementation", date(2008,8,12), date(2008,9,12), 0.0)); | + | ganttmodel.addValue("Scheduled", new GanttTask("Obtain Approval", date(2008,4,9), date(2008,4,9), 0.0)); |
| − | ganttmodel.addValue("Scheduled", new GanttTask("Testing", date(2008,9,13), date(2008,10,31), 0.0)); | + | ganttmodel.addValue("Scheduled", new GanttTask("Requirements Analysis", date(2008,4,10), date(2008,5,5), 0.0)); |
| − | ganttmodel.addValue("Scheduled", new GanttTask("Final Implementation", date(2008,11,1), date(2008,11,15), 0.0)); | + | ganttmodel.addValue("Scheduled", new GanttTask("Design Phase", date(2008,5,6), date(2008,5,30), 0.0)); |
| − | ganttmodel.addValue("Scheduled", new GanttTask("Signoff", date(2008,11,28), date(2008,11,30), 0.0)); | + | ganttmodel.addValue("Scheduled", new GanttTask("Design Signoff", date(2008,6,2), date(2008,6,2), 0.0)); |
| − | + | ganttmodel.addValue("Scheduled", new GanttTask("Alpha Implementation", date(2008,6,3), date(2008,7,31), 0.0)); | |
| − | ganttmodel.addValue("Actual", new GanttTask("Write Proposal", date(2008,4,1), date(2008,4,3), 0.0)); | + | ganttmodel.addValue("Scheduled", new GanttTask("Design Review", date(2008,8,1), date(2008,8,8), 0.0)); |
| − | ganttmodel.addValue("Actual", new GanttTask("Obtain Approval", date(2008,4,9), date(2008,4,9), 0.0)); | + | ganttmodel.addValue("Scheduled", new GanttTask("Revised Design Signoff", date(2008,8,10), date(2008,8,10), 0.0)); |
| − | ganttmodel.addValue("Actual", new GanttTask("Requirements Analysis", date(2008,4,10), date(2008,5,15), 0.0)); | + | ganttmodel.addValue("Scheduled", new GanttTask("Beta Implementation", date(2008,8,12), date(2008,9,12), 0.0)); |
| − | ganttmodel.addValue("Actual", new GanttTask("Design Phase", date(2008,5,15), date(2008,6,17), 0.0)); | + | ganttmodel.addValue("Scheduled", new GanttTask("Testing", date(2008,9,13), date(2008,10,31), 0.0)); |
| − | ganttmodel.addValue("Actual", new GanttTask("Design Signoff", date(2008,6,30), date(2008,6,30), 0.0)); | + | ganttmodel.addValue("Scheduled", new GanttTask("Final Implementation", date(2008,11,1), date(2008,11,15), 0.0)); |
| − | ganttmodel.addValue("Actual", new GanttTask("Alpha Implementation", date(2008,7,1), date(2008,9,12), 0.0)); | + | ganttmodel.addValue("Scheduled", new GanttTask("Signoff", date(2008,11,28), date(2008,11,30), 0.0)); |
| − | ganttmodel.addValue("Actual", new GanttTask("Design Review", date(2008,9,12), date(2008,9,22), 0.0)); | + | |
| − | ganttmodel.addValue("Actual", new GanttTask("Revised Design Signoff", date(2008,9,25), date(2008,9,27), 0.0)); | + | ganttmodel.addValue("Actual", new GanttTask("Write Proposal", date(2008,4,1), date(2008,4,3), 0.0)); |
| − | ganttmodel.addValue("Actual", new GanttTask("Beta Implementation", date(2008,8,12), date(2008,9,12), 0.0)); | + | ganttmodel.addValue("Actual", new GanttTask("Obtain Approval", date(2008,4,9), date(2008,4,9), 0.0)); |
| − | ganttmodel.addValue("Actual", new GanttTask("Testing", date(2008,10,31), date(2008,11,17), 0.0)); | + | ganttmodel.addValue("Actual", new GanttTask("Requirements Analysis", date(2008,4,10), date(2008,5,15), 0.0)); |
| − | ganttmodel.addValue("Actual", new GanttTask("Final Implementation", date(2008,11,18), date(2008,12,5), 0.0)); | + | ganttmodel.addValue("Actual", new GanttTask("Design Phase", date(2008,5,15), date(2008,6,17), 0.0)); |
| − | ganttmodel.addValue("Actual", new GanttTask("Signoff", date(2008,12,10), date(2008,12,11), 0.0)); | + | ganttmodel.addValue("Actual", new GanttTask("Design Signoff", date(2008,6,30), date(2008,6,30), 0.0)); |
| − | + | ganttmodel.addValue("Actual", new GanttTask("Alpha Implementation", date(2008,7,1), date(2008,9,12), 0.0)); | |
| − | + | ganttmodel.addValue("Actual", new GanttTask("Design Review", date(2008,9,12), date(2008,9,22), 0.0)); | |
| − | + | ganttmodel.addValue("Actual", new GanttTask("Revised Design Signoff", date(2008,9,25), date(2008,9,27), 0.0)); | |
| − | + | ganttmodel.addValue("Actual", new GanttTask("Beta Implementation", date(2008,8,12), date(2008,9,12), 0.0)); | |
| − | + | ganttmodel.addValue("Actual", new GanttTask("Testing", date(2008,10,31), date(2008,11,17), 0.0)); | |
| − | + | ganttmodel.addValue("Actual", new GanttTask("Final Implementation", date(2008,11,18), date(2008,12,5), 0.0)); | |
| − | + | ganttmodel.addValue("Actual", new GanttTask("Signoff", date(2008,12,10), date(2008,12,11), 0.0)); | |
| − | + | gantt.setModel(ganttmodel); | |
| − | </zscript> | + | ]]></zscript> |
| − | </ | + | </chart> |
</source> | </source> | ||
| Line 564: | Line 564: | ||
|- | |- | ||
| − | | < | + | | <code>getAreaListener</code> |
| Returns the renderer to render each area, or null if the default renderer is used. | | Returns the renderer to render each area, or null if the default renderer is used. | ||
| − | | < | + | | <code>ChartAreaListener</code> |
|- | |- | ||
| − | | < | + | | <code>getBgRGB</code> |
| Get the background color in int array (0: red, 1: green, 2:blue). | | Get the background color in int array (0: red, 1: green, 2:blue). | ||
| − | | < | + | | <code>int[]</code> |
|- | |- | ||
| − | | < | + | | <code>getEngine</code> |
| Returns the implemetation chart engine. | | Returns the implemetation chart engine. | ||
| − | | < | + | | <code>ChartEngine</code> |
|- | |- | ||
| − | | < | + | | <code>getIntHeight</code> |
| Get the chart int width in pixel | | Get the chart int width in pixel | ||
| − | | < | + | | <code>int</code> |
|- | |- | ||
| − | | < | + | | <code>getIntWidth</code> |
| Get the chart int width in pixel | | Get the chart int width in pixel | ||
| − | | < | + | | <code>int</code> |
|- | |- | ||
| − | | < | + | | <code>getModel</code> |
| Returns the chart model associated with this chart, or null if this chart is not associated with any chart data model | | Returns the chart model associated with this chart, or null if this chart is not associated with any chart data model | ||
| − | | < | + | | <code>ChartModel</code> |
|- | |- | ||
| − | | < | + | | <code>getPaneRGB</code> |
| Get the pane color in int array (0: red, 1: green, 2:blue). | | Get the pane color in int array (0: red, 1: green, 2:blue). | ||
| − | | < | + | | <code>int[]</code> |
|- | |- | ||
| − | | < | + | | <code>getTimeZone</code> |
| Returns the time zone that this Time Series Chart belongs to, or null if the default time zone is used. | | Returns the time zone that this Time Series Chart belongs to, or null if the default time zone is used. | ||
| − | | < | + | | <code>TimeZone</code> |
|- | |- | ||
| − | | < | + | | <code>newChartEngine</code> |
| Instantiates the default chart engine | | Instantiates the default chart engine | ||
| − | | < | + | | <code>ChartEngine</code> |
|- | |- | ||
| − | | < | + | | <code>setAreaListener</code> |
| Sets the renderer which is used to render each area | | Sets the renderer which is used to render each area | ||
| | | | ||
|- | |- | ||
| − | | < | + | | <code>setEngine</code> |
| Sets the chart engine | | Sets the chart engine | ||
| | | | ||
|- | |- | ||
| − | | < | + | | <code>setModel</code> |
| Sets the chart model associated with this chart | | Sets the chart model associated with this chart | ||
| | | | ||
|- | |- | ||
| − | | < | + | | <code>setTimeZone</code> |
| Sets the time zone that this Time Series Chart belongs to, or null if the default time zone is used | | Sets the time zone that this Time Series Chart belongs to, or null if the default time zone is used | ||
| | | | ||
|- | |- | ||
| − | | < | + | | <code>smartDrawChart</code> |
| mark a draw flag to inform that this Chart needs update | | mark a draw flag to inform that this Chart needs update | ||
| | | | ||
| Line 645: | Line 645: | ||
|- | |- | ||
| − | | <center>< | + | | <center><code>bgAlpha</code></center> |
| Sets the background alpha (transparency, 0 ~ 255). | | Sets the background alpha (transparency, 0 ~ 255). | ||
| − | | <center>< | + | | <center><code>int</code></center> |
| − | | <center>< | + | | <center><code>255</code></center> |
|- | |- | ||
| − | | <center>< | + | | <center><code>bgColor</code></center> |
| − | | Sets the background color of the chart.It must be in < | + | | Sets the background color of the chart.It must be in <code>#RRGGBB</code> format (hexdecimal). |
| − | | <center>< | + | | <center><code>String</code></center> |
| − | | <center>< | + | | <center><code>null</code></center> |
|- | |- | ||
| − | | <center>< | + | | <center><code>fgAlpha</code></center> |
| Sets the foreground alpha (transparency, 0 ~ 255). | | Sets the foreground alpha (transparency, 0 ~ 255). | ||
| − | | <center>< | + | | <center><code>int</code></center> |
| − | | <center>< | + | | <center><code>255</code></center> |
|- | |- | ||
| − | | <center>< | + | | <center><code>height</code></center> |
| Sets height of chart, it must be a integer string | | Sets height of chart, it must be a integer string | ||
| − | | <center>< | + | | <center><code>String</code></center> |
| − | | <center>< | + | | <center><code>200</code></center> |
|- | |- | ||
| − | | <center>< | + | | <center><code>orient</code></center> |
| Sets the chart orientation. | | Sets the chart orientation. | ||
| − | Values: < | + | Values: <code>vertical | horizontal </code> |
| − | | <center>< | + | | <center><code>String</code></center> |
| − | | <center>< | + | | <center><code>vertical</code></center> |
|- | |- | ||
| − | | <center>< | + | | <center><code>paneAlpha</code></center> |
| Sets the pane alpha (transparency, 0 ~ 255). | | Sets the pane alpha (transparency, 0 ~ 255). | ||
| − | | <center>< | + | | <center><code>int</code></center> |
| − | | <center>< | + | | <center><code>255</code></center> |
|- | |- | ||
| − | | <center>< | + | | <center><code>panelColor</code></center> |
| − | | Sets the pane color of the chart.It must be < | + | | Sets the pane color of the chart.It must be <code>#RRGGBB</code> format (hexdecimal). |
| − | | <center>< | + | | <center><code>String</code></center> |
| − | | <center>< | + | | <center><code>null</code></center> |
|- | |- | ||
| − | | <center>< | + | | <center><code>period</code></center> |
| Sets the period used in Time Series Chart. | | Sets the period used in Time Series Chart. | ||
Values : millisecond | second | minute | | hour | day | week | month | quarter | year | Values : millisecond | second | minute | | hour | day | week | month | quarter | year | ||
| − | | <center>< | + | | <center><code>String</code></center> |
| − | | <center>< | + | | <center><code>null</code></center> |
|- | |- | ||
| − | | <center>< | + | | <center><code>showLegend</code></center> |
| Sets the flag of showing the chart's legend | | Sets the flag of showing the chart's legend | ||
| − | | <center>< | + | | <center><code>boolean</code></center> |
| − | | <center>< | + | | <center><code>true</code></center> |
|- | |- | ||
| − | | <center>< | + | | <center><code>showTooltiptext</code></center> |
| Sets the flag of showing the chart's tool tip text | | Sets the flag of showing the chart's tool tip text | ||
| − | | <center>< | + | | <center><code>boolean</code></center> |
| − | | <center>< | + | | <center><code>true</code></center> |
|- | |- | ||
| − | | <center>< | + | | <center><code>threeD</code></center> |
| Sets true to show three dimensional graph (If a type of chart got no 3d peer, this is ignored). | | Sets true to show three dimensional graph (If a type of chart got no 3d peer, this is ignored). | ||
| − | | <center>< | + | | <center><code>boolean</code></center> |
| − | | <center>< | + | | <center><code>false</code></center> |
|- | |- | ||
| − | | <center>< | + | | <center><code>title</code></center> |
| Sets the chart's title. | | Sets the chart's title. | ||
| − | | <center>< | + | | <center><code>String</code></center> |
| − | | <center>< | + | | <center><code>null</code></center> |
|- | |- | ||
| − | | <center>< | + | | <center><code>type</code></center> |
| Set the chart's type | | Set the chart's type | ||
| − | Values: < | + | Values: <code>pie | ring | bar | line | area | stacked_bar</code> | <code>stacked_</code>area | <code>waterfall | polar | scatter | time_series | polar | step_area</code> | <code>step | histogram | candlestick | hilow </code> |
| − | | <center>< | + | | <center><code>String</code></center> |
| − | | <center>< | + | | <center><code>null</code></center> |
|- | |- | ||
| − | | <center>< | + | | <center><code>width</code></center> |
| Sets width of chart, it must be a integer string | | Sets width of chart, it must be a integer string | ||
| − | | <center>< | + | | <center><code>String</code></center> |
| − | | <center>< | + | | <center><code>400</code></center> |
|- | |- | ||
| − | | <center>< | + | | <center><code>xAxis</code></center> |
| Sets the label in xAxis. | | Sets the label in xAxis. | ||
| − | | <center>< | + | | <center><code>String</code></center> |
| − | | <center>< | + | | <center><code>null</code></center> |
|- | |- | ||
| − | | <center>< | + | | <center><code>yAxis</code></center> |
| Sets the label in yAxis. | | Sets the label in yAxis. | ||
| − | | <center>< | + | | <center><code>String</code></center> |
| − | | <center>< | + | | <center><code>null</code></center> |
|} | |} | ||
| Line 756: | Line 756: | ||
|- | |- | ||
| − | | <center>< | + | | <center><code>onClick</code></center> |
| [#MouseEvent org.zkoss.zk.ui.event.MouseEvent] | | [#MouseEvent org.zkoss.zk.ui.event.MouseEvent] | ||
| − | < | + | <code>'''Description:''' Denotes user has clicked the component.</code> |
| − | < | + | <code>Use getX(), getY() method to get coordinates.</code> |
| − | < | + | <code>Use getArea() method to get the area component which user clicks on.</code> |
|} | |} | ||
Latest revision as of 04:17, 20 January 2022
Bernd Will
March 19, 2009
ZK 3.5 or higher
Chart
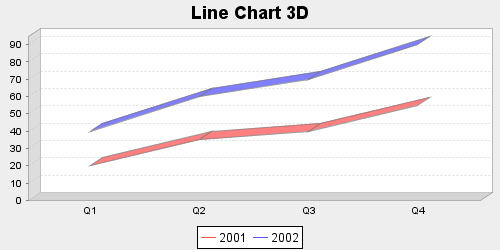
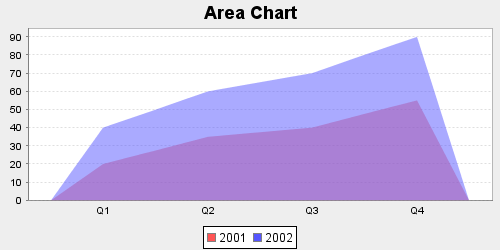
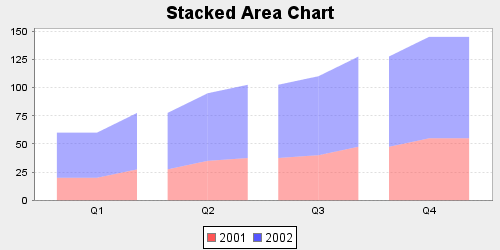
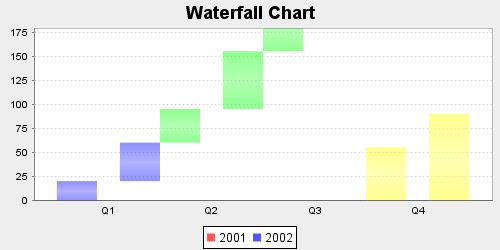
Did you know, that ZK offers 29 chart types out of the box ?
You can find the latest source code of the examples at this address: [1]
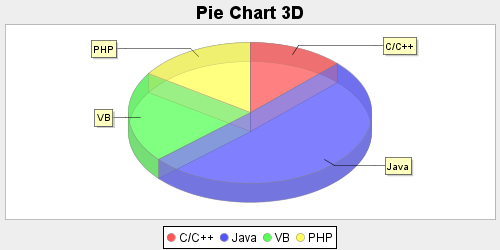
To use a chart component , developers must prepare a ChartModel and a ChartEngine. Developers also set proper chart type, and the threeD (3D) attribute to draw proper chart. The model and type must fit together, or the result is unpredictable. The 3D chart is not supported on all chart type.
available chart types
pie |
PieModel
|
o |
ring |
PieModel
|
x |
bar |
CategoryModel
|
o |
line |
CategoryModel or XYModel
|
o |
area |
CategoryModel or XYModel
|
x |
stacked_bar |
CategoryModel
|
o |
stacked_area |
CategoryModel or XYModel
|
x |
waterfall |
CategoryModel
|
x |
polar |
XYModel
|
|
scatter |
XYModel
|
|
time_series |
XYModel
|
|
polar |
XYModel
|
|
step_area |
XYModel
|
|
step |
XYModel
|
|
histogram |
XYModel
|
|
candlestick |
HiLoModel
|
|
hilow |
HiLoModel
|
|
XYZ |
XYZModel
|
|
wafer |
wafermodel
|
|
gantt |
ganttmodel
|
|
wind |
windmodel
|
typical charting code sequence
<vbox>
     <chart id="mychart" title="Pie Chart Demo" width="500" height="250" type="pie" threeD="true" fgAlpha="128"/>
     <zscript>
         PieModel model = new MyPieModel();
         ... fill the model here ...
         mychart.setModel(model);
     </zscript>
 </vbox>
Charts based on Pie Model
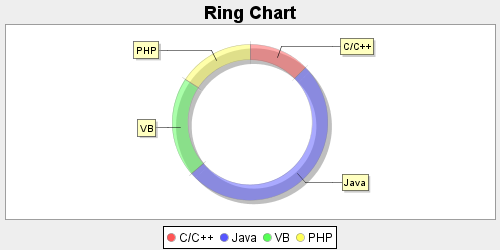
pie |
PieModel
|
o |
ring |
PieModel
|
x |
 <vbox>
 <zscript>
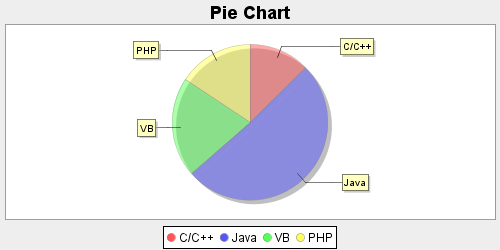
   PieModel piemodel = new SimplePieModel();
   piemodel.setValue("C/C++", new Double(12.5));
   piemodel.setValue("Java", new Double(50.2));
   piemodel.setValue("VB", new Double(20.5));
   piemodel.setValue("PHP", new Double(15.5));
 </zscript>
 	<label value="pie" />
 	<chart id="piechart" title="Pie Chart" width="500" height="250"
 		type="pie" threeD="false" fgAlpha="128" onClick="drilldown()" />
 	<zscript>
   piechart.setModel(piemodel);
 </zscript>
 </vbox>
Charts based on Category Model
bar |
CategoryModel
|
o |
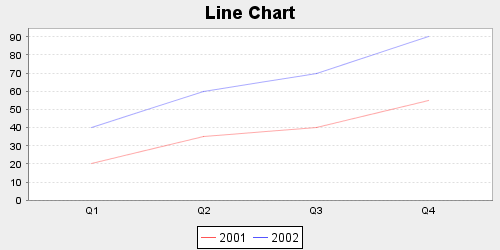
line |
CategoryModel or XYModel
|
o |
area |
CategoryModel or XYModel
|
x |
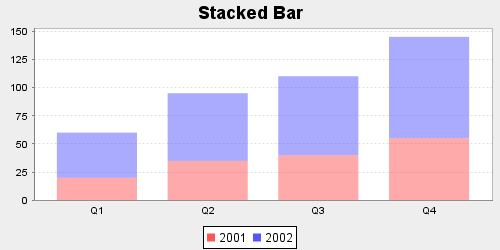
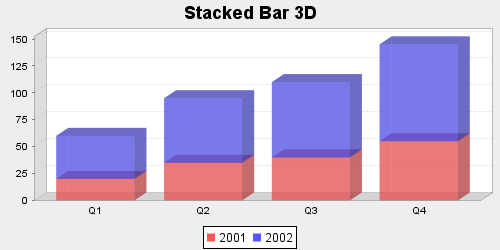
stacked_bar |
CategoryModel
|
o |
stacked_area |
CategoryModel or XYModel
|
x |
waterfall |
CategoryModel
|
x |
<vbox>
<zscript>
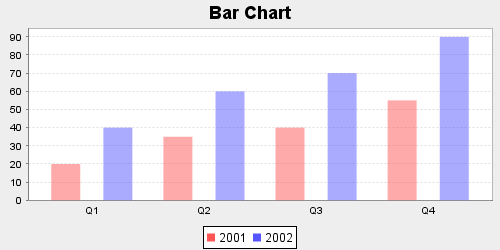
CategoryModel catmodel = new SimpleCategoryModel();
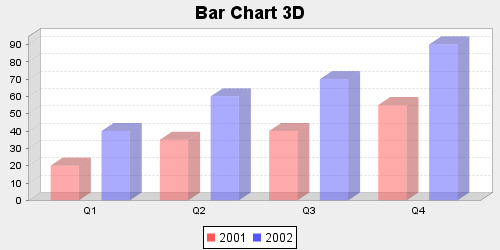
catmodel.setValue("2001", "Q1", new Integer(20));
catmodel.setValue("2001", "Q2", new Integer(35));
catmodel.setValue("2001", "Q3", new Integer(40));
catmodel.setValue("2001", "Q4", new Integer(55));
catmodel.setValue("2002", "Q1", new Integer(40));
catmodel.setValue("2002", "Q2", new Integer(60));
catmodel.setValue("2002", "Q3", new Integer(70));
catmodel.setValue("2002", "Q4", new Integer(90));
</zscript>

	<label value="bar" />
	<chart id="barchart" title="Bar Chart" width="500" height="250"
		type="bar" threeD="false" fgAlpha="128" onClick="drilldown()" />
	<zscript>
  barchart.setModel(catmodel);
</zscript>
</vbox>
Charts based on XY Model
line |
CategoryModel or XYModel
|
o |
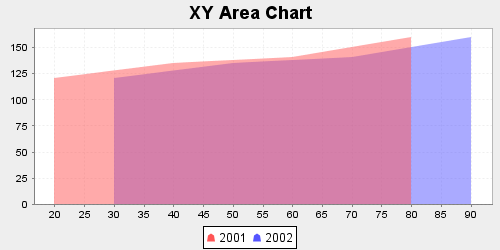
area |
CategoryModel or XYModel
|
x |
stacked_area |
CategoryModel or XYModel
|
x |
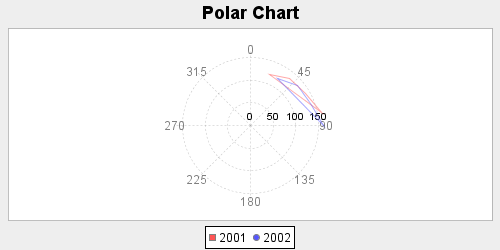
polar |
XYModel
|
|
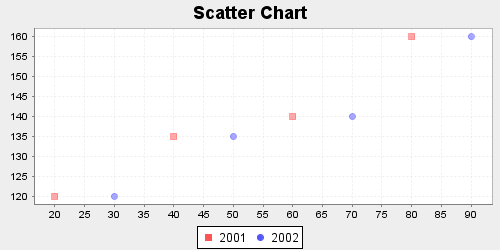
scatter |
XYModel
|
|
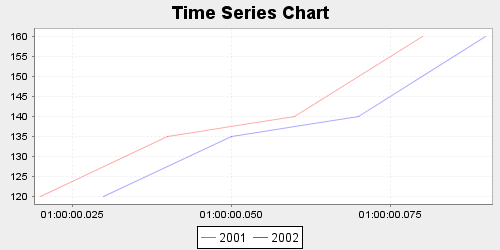
time_series |
XYModel
|
|
polar |
XYModel
|
|
step_area |
XYModel
|
|
step |
XYModel
|
|
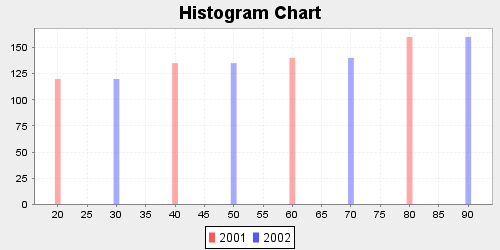
histogram |
XYModel
|
<vbox>
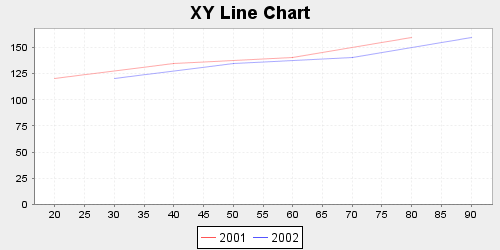
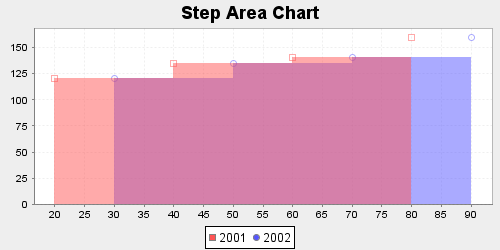
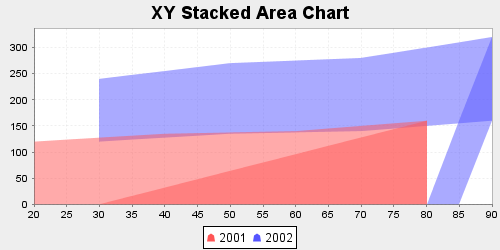
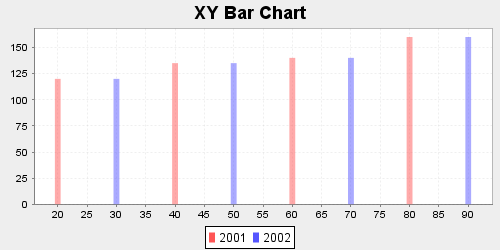
<zscript>
XYModel xymodel = new SimpleXYModel();
xymodel.addValue("2001", new Integer(20), new Integer(120));
xymodel.addValue("2001", new Integer(40), new Integer(135));
xymodel.addValue("2001", new Integer(60), new Integer(140));
xymodel.addValue("2001", new Integer(80), new Integer(160));

xymodel.addValue("2002", new Integer(30), new Integer(120));
xymodel.addValue("2002", new Integer(50), new Integer(135));
xymodel.addValue("2002", new Integer(70), new Integer(140));
xymodel.addValue("2002", new Integer(90), new Integer(160));
</zscript>


	<label value="polar" />
	<chart id="polar" title="Polar Chart" width="500" height="250"
		type="polar" threeD="false" fgAlpha="128" onClick="drilldown()" />
	<zscript>
  polar.setModel(xymodel);
</zscript>
</vbox>
<vbox>
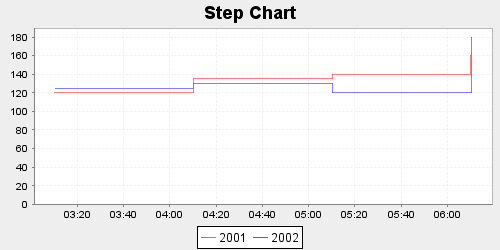
<zscript>
XYModel datemodel = new SimpleXYModel();
datemodel.addValue("2001", new Long(time(2001, 5, 2, 1, 10, 15).getTime()), new Integer(120));
datemodel.addValue("2001", new Long(time(2001, 5, 2, 2, 10, 15).getTime()), new Integer(135));
datemodel.addValue("2001", new Long(time(2001, 5, 2, 3, 10, 15).getTime()), new Integer(140));
datemodel.addValue("2001", new Long(time(2001, 5, 2, 4, 10, 15).getTime()), new Integer(160));

datemodel.addValue("2002", new Long(time(2001, 5, 2, 1, 10, 20).getTime()), new Integer(125));
datemodel.addValue("2002", new Long(time(2001, 5, 2, 2, 10, 20).getTime()), new Integer(130));
datemodel.addValue("2002", new Long(time(2001, 5, 2, 3, 10, 20).getTime()), new Integer(120));
datemodel.addValue("2002", new Long(time(2001, 5, 2, 4, 10, 20).getTime()), new Integer(180));
</zscript>

	<label value="step" />
	<chart id="step" title="Step Chart" width="500" height="250"
		type="step" threeD="false" fgAlpha="128" onClick="drilldown()" />
	<zscript>
  step.setModel(datemodel);
</zscript>
</vbox>
Charts based on HiLo Model
candlestick |
HiLoModel
|
|
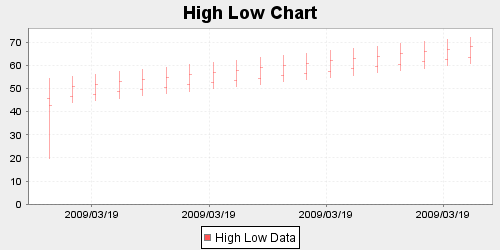
hilow |
HiLoModel
|
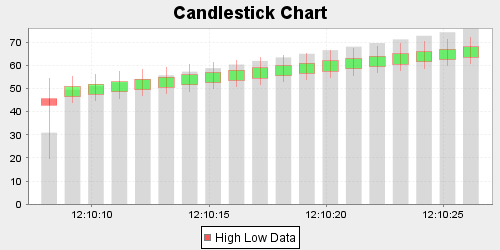
The data model needs this input data:
- date
- open
- high
- low
- close
- volume
<vbox>
<zscript>
HiLoModel hilomodel = new SimpleHiLoModel();
long d = new Date().getTime();
hilomodel.addValue(new Date(d),  new Double(45.5),  new Double(54.2), new Double(19.9), new Double(42.8), new Double(20));
hilomodel.addValue(new Date(d+1000),  new Double(46.5),  new Double(55.2),  new Double(43.8), new Double(50.9),   new Double(32));
hilomodel.addValue(new Date(d+2000),  new Double(47.5),  new Double(56.2),  new Double(44.8), new Double(51.9),   new Double(33));
hilomodel.addValue(new Date(d+3000),  new Double(48.5),  new Double(57.2),  new Double(45.8), new Double(52.9),   new Double(34));
hilomodel.addValue(new Date(d+4000),  new Double(49.5),  new Double(58.2),  new Double(46.8), new Double(53.9),   new Double(35));
hilomodel.addValue(new Date(d+5000),  new Double(50.5),  new Double(59.2),  new Double(47.8), new Double(54.9),   new Double(36));
hilomodel.addValue(new Date(d+6000),  new Double(51.5),  new Double(60.2),  new Double(48.8), new Double(55.9),   new Double(37));
hilomodel.addValue(new Date(d+7000),  new Double(52.5),  new Double(61.2),  new Double(49.8), new Double(56.9),   new Double(38));
hilomodel.addValue(new Date(d+8000),  new Double(53.5),  new Double(62.2),  new Double(50.8), new Double(57.9),   new Double(39));
hilomodel.addValue(new Date(d+9000),  new Double(54.5),  new Double(63.2),  new Double(51.8), new Double(58.9),   new Double(40));
hilomodel.addValue(new Date(d+10000),  new Double(55.5),  new Double(64.2),  new Double(52.8), new Double(59.9),   new Double(41));
hilomodel.addValue(new Date(d+11000),  new Double(56.5),  new Double(65.2),  new Double(53.8), new Double(60.9),   new Double(42));
hilomodel.addValue(new Date(d+12000),  new Double(57.5),  new Double(66.2),  new Double(54.8), new Double(61.9),   new Double(43));
hilomodel.addValue(new Date(d+13000),  new Double(58.5),  new Double(67.2),  new Double(55.8), new Double(62.9),   new Double(44));
hilomodel.addValue(new Date(d+14000),  new Double(59.5),  new Double(68.2),  new Double(56.8), new Double(63.9),   new Double(45));
hilomodel.addValue(new Date(d+15000),  new Double(60.5),  new Double(69.2),  new Double(57.8), new Double(64.9),   new Double(46));
hilomodel.addValue(new Date(d+16000),  new Double(61.5),  new Double(70.2),  new Double(58.8), new Double(65.9),   new Double(47));
hilomodel.addValue(new Date(d+17000),  new Double(62.5),  new Double(71.2),  new Double(59.8), new Double(66.9),   new Double(48));
hilomodel.addValue(new Date(d+18000),  new Double(63.5),  new Double(72.2),  new Double(60.8), new Double(67.9),   new Double(49));
</zscript>

	<label value="candlestick" />
	<chart id="candlestick" title="Candlestick Chart" width="500"
		height="250" type="candlestick" threeD="false" fgAlpha="128"
		onClick="drilldown()" />
	<zscript>
  candlestick.setModel(hilomodel);
</zscript>
</vbox>
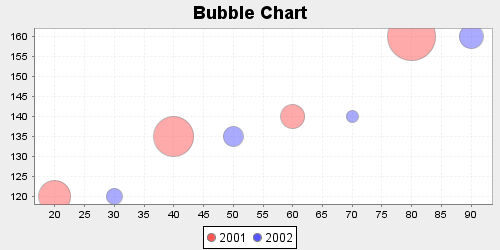
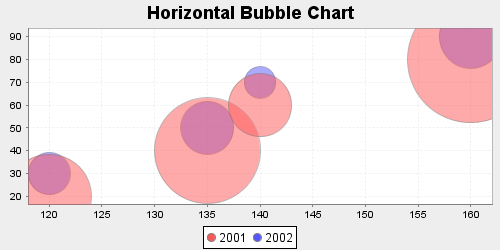
Charts based on XYZ Model
<vbox>
<zscript>
XYZModel xyzmodel = new SimpleXYZModel();
xyzmodel.addValue("2001", new Integer(20), new Integer(120), new Integer(8));
xyzmodel.addValue("2001", new Integer(40), new Integer(135), new Integer(10));
xyzmodel.addValue("2001", new Integer(60), new Integer(140), new Integer(6));
xyzmodel.addValue("2001", new Integer(80), new Integer(160), new Integer(12));

xyzmodel.addValue("2002", new Integer(30), new Integer(120), new Integer(4));
xyzmodel.addValue("2002", new Integer(50), new Integer(135), new Integer(5));
xyzmodel.addValue("2002", new Integer(70), new Integer(140), new Integer(3));
xyzmodel.addValue("2002", new Integer(90), new Integer(160), new Integer(6));
</zscript>

	<label value="bubble" />
	<chart id="bubble" title="Bubble Chart" width="500" height="250"
		type="bubble" threeD="false" fgAlpha="128" onClick="drilldown()" />
	<zscript>
  bubble.setModel(xyzmodel);
</zscript>
</vbox>
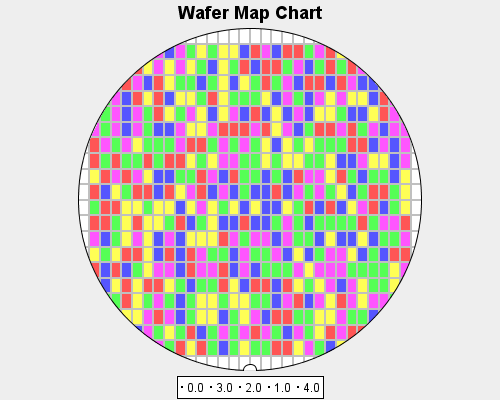
Charts based on Wafer Model
<vbox>
<zscript><![CDATA[
final int xdim = 30;
final int ydim = 20;
final Random random = new Random();
WaferMapModel wafermodel = new WaferMapModel(xdim, ydim);
for (int x = 0; x < xdim; x++) {
	for (int y = 0; y < ydim; y++) {
		wafermodel.addValue(random.nextInt(5), x, y);
	}
}
]]></zscript>

	<label value="wafermap" />
	<chart id="wafermap" title="Wafer Map Chart" width="500"
		height="400" type="wafermap" threeD="false" fgAlpha="128"
		onClick="drilldown()" />
	<zscript>
  wafermap.setModel(wafermodel);
</zscript>
</vbox>
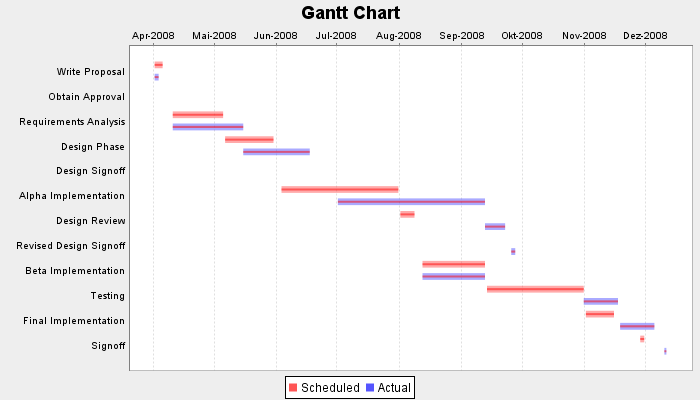
Charts based on Gantt Model
<chart id="gantt" title="Gantt Chart" width="700" height="400"
        type="gantt" threeD="false" fgAlpha="128" dateFormat="yyyy/MM/dd" >
    <zscript><![CDATA[
        import org.zkoss.zul.GanttModel.GanttTask;

        public Date date(int year, int month, int day) {
            final java.util.Calendar calendar = java.util.Calendar.getInstance();
            calendar.set(year, month-1, day);
            final Date result = calendar.getTime();
            return result;
        }
        //series, task (task description, start, end, complete percentage)
        GanttModel ganttmodel = new GanttModel();
        ganttmodel.addValue("Scheduled", new GanttTask("Write Proposal", date(2008,4,1), date(2008,4,5), 0.0));
        ganttmodel.addValue("Scheduled", new GanttTask("Obtain Approval", date(2008,4,9), date(2008,4,9), 0.0));
        ganttmodel.addValue("Scheduled", new GanttTask("Requirements Analysis", date(2008,4,10), date(2008,5,5), 0.0));
        ganttmodel.addValue("Scheduled", new GanttTask("Design Phase", date(2008,5,6), date(2008,5,30), 0.0));
        ganttmodel.addValue("Scheduled", new GanttTask("Design Signoff", date(2008,6,2), date(2008,6,2), 0.0));
        ganttmodel.addValue("Scheduled", new GanttTask("Alpha Implementation", date(2008,6,3), date(2008,7,31), 0.0));
        ganttmodel.addValue("Scheduled", new GanttTask("Design Review", date(2008,8,1), date(2008,8,8), 0.0));
        ganttmodel.addValue("Scheduled", new GanttTask("Revised Design Signoff", date(2008,8,10), date(2008,8,10), 0.0));
        ganttmodel.addValue("Scheduled", new GanttTask("Beta Implementation", date(2008,8,12), date(2008,9,12), 0.0));
        ganttmodel.addValue("Scheduled", new GanttTask("Testing", date(2008,9,13), date(2008,10,31), 0.0));
        ganttmodel.addValue("Scheduled", new GanttTask("Final Implementation", date(2008,11,1), date(2008,11,15), 0.0));
        ganttmodel.addValue("Scheduled", new GanttTask("Signoff", date(2008,11,28), date(2008,11,30), 0.0));

        ganttmodel.addValue("Actual", new GanttTask("Write Proposal", date(2008,4,1), date(2008,4,3), 0.0));
        ganttmodel.addValue("Actual", new GanttTask("Obtain Approval", date(2008,4,9), date(2008,4,9), 0.0));
        ganttmodel.addValue("Actual", new GanttTask("Requirements Analysis", date(2008,4,10), date(2008,5,15), 0.0));
        ganttmodel.addValue("Actual", new GanttTask("Design Phase", date(2008,5,15), date(2008,6,17), 0.0));
        ganttmodel.addValue("Actual", new GanttTask("Design Signoff", date(2008,6,30), date(2008,6,30), 0.0));
        ganttmodel.addValue("Actual", new GanttTask("Alpha Implementation", date(2008,7,1), date(2008,9,12), 0.0));
        ganttmodel.addValue("Actual", new GanttTask("Design Review", date(2008,9,12), date(2008,9,22), 0.0));
        ganttmodel.addValue("Actual", new GanttTask("Revised Design Signoff", date(2008,9,25), date(2008,9,27), 0.0));
        ganttmodel.addValue("Actual", new GanttTask("Beta Implementation", date(2008,8,12), date(2008,9,12), 0.0));
        ganttmodel.addValue("Actual", new GanttTask("Testing", date(2008,10,31), date(2008,11,17), 0.0));
        ganttmodel.addValue("Actual", new GanttTask("Final Implementation", date(2008,11,18), date(2008,12,5), 0.0));
        ganttmodel.addValue("Actual", new GanttTask("Signoff", date(2008,12,10), date(2008,12,11), 0.0));
        gantt.setModel(ganttmodel);
    ]]></zscript>
</chart>
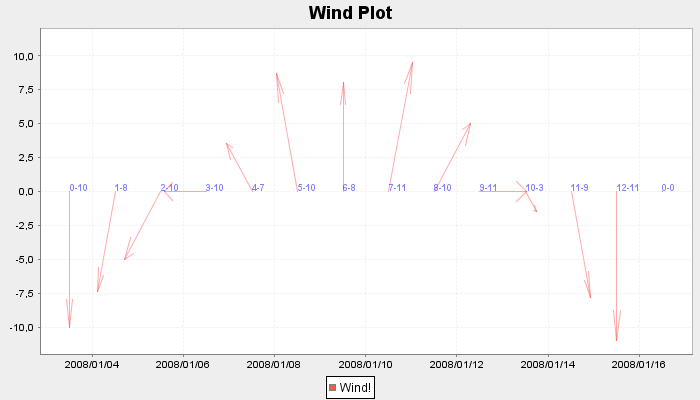
Charts based on Wind Model
<vbox>
<zscript>
XYZModel windmodel = new SimpleXYZModel();
//series, date, direction (0-12), force(0-12)
windmodel.addValue("Wind!", new Long(date(2008, 1, 3).getTime()), new Double(0d), new Double(10.0));
windmodel.addValue("Wind!", new Long(date(2008, 1, 4).getTime()), new Double(1d), new Double(8.5));
windmodel.addValue("Wind!", new Long(date(2008, 1, 5).getTime()), new Double(2.0), new Double(10.0));
windmodel.addValue("Wind!", new Long(date(2008, 1, 6).getTime()), new Double(3.0), new Double(10.0));
windmodel.addValue("Wind!", new Long(date(2008, 1, 7).getTime()), new Double(4.0), new Double(7.0));
windmodel.addValue("Wind!", new Long(date(2008, 1, 8).getTime()), new Double(5.0), new Double(10.0));
windmodel.addValue("Wind!", new Long(date(2008, 1, 9).getTime()), new Double(6.0), new Double(8.0));
windmodel.addValue("Wind!", new Long(date(2008, 1, 10).getTime()), new Double(7.0), new Double(11.0));
windmodel.addValue("Wind!", new Long(date(2008, 1, 11).getTime()), new Double(8.0), new Double(10.0));
windmodel.addValue("Wind!", new Long(date(2008, 1, 12).getTime()), new Double(9.0), new Double(11.0));
windmodel.addValue("Wind!", new Long(date(2008, 1, 13).getTime()), new Double(10.0), new Double(3.0));
windmodel.addValue("Wind!", new Long(date(2008, 1, 14).getTime()), new Double(11.0), new Double(9.0));
windmodel.addValue("Wind!", new Long(date(2008, 1, 15).getTime()), new Double(12.0), new Double(11.0));
windmodel.addValue("Wind!", new Long(date(2008, 1, 16).getTime()), new Double(0.0), new Double(0.0));
</zscript>

	<label value="wind" />
	<chart id="wind" title="Wind Plot" width="700" height="400"
		type="wind" threeD="false" fgAlpha="128" onClick="drilldown()"
		dateFormat="yyyy/MM/dd" />
	<zscript>
  wind.setModel(windmodel);
</zscript>
</vbox>
Methods
getAreaListener
|
Returns the renderer to render each area, or null if the default renderer is used. | ChartAreaListener
|
getBgRGB
|
Get the background color in int array (0: red, 1: green, 2:blue). | int[]
|
getEngine
|
Returns the implemetation chart engine. | ChartEngine
|
getIntHeight
|
Get the chart int width in pixel | int
|
getIntWidth
|
Get the chart int width in pixel | int
|
getModel
|
Returns the chart model associated with this chart, or null if this chart is not associated with any chart data model | ChartModel
|
getPaneRGB
|
Get the pane color in int array (0: red, 1: green, 2:blue). | int[]
|
getTimeZone
|
Returns the time zone that this Time Series Chart belongs to, or null if the default time zone is used. | TimeZone
|
newChartEngine
|
Instantiates the default chart engine | ChartEngine
|
setAreaListener
|
Sets the renderer which is used to render each area | |
setEngine
|
Sets the chart engine | |
setModel
|
Sets the chart model associated with this chart | |
setTimeZone
|
Sets the time zone that this Time Series Chart belongs to, or null if the default time zone is used | |
smartDrawChart
|
mark a draw flag to inform that this Chart needs update |
Properties
bgAlpha |
Sets the background alpha (transparency, 0 ~ 255). | int |
255 |
bgColor |
Sets the background color of the chart.It must be in #RRGGBB format (hexdecimal).
|
String |
null |
fgAlpha |
Sets the foreground alpha (transparency, 0 ~ 255). | int |
255 |
height |
Sets height of chart, it must be a integer string | String |
200 |
orient |
Sets the chart orientation.
Values: |
String |
vertical |
paneAlpha |
Sets the pane alpha (transparency, 0 ~ 255). | int |
255 |
panelColor |
Sets the pane color of the chart.It must be #RRGGBB format (hexdecimal).
|
String |
null |
period |
Sets the period used in Time Series Chart.
Values : millisecond | second | minute | | hour | day | week | month | quarter | year |
String |
null |
showLegend |
Sets the flag of showing the chart's legend | boolean |
true |
showTooltiptext |
Sets the flag of showing the chart's tool tip text | boolean |
true |
threeD |
Sets true to show three dimensional graph (If a type of chart got no 3d peer, this is ignored). | boolean |
false |
title |
Sets the chart's title. | String |
null |
type |
Set the chart's type
Values: |
String |
null |
width |
Sets width of chart, it must be a integer string | String |
400 |
xAxis |
Sets the label in xAxis. | String |
null |
yAxis |
Sets the label in yAxis. | String |
null |
Supported Events
onClick |
[#MouseEvent org.zkoss.zk.ui.event.MouseEvent]
|
onClick event handling
If you want to catch the clicks onto chart elements, you can use this source code:
<zscript>
  void drilldown() {
  	String areaid = event.getArea();
  	if (areaid != null) {
	  	Area area = self.getFellow(areaid);
	  	alert(""+area.getAttribute("entity")+": "+area.getTooltiptext());
	}
  }
</zscript>
| Copyright © Bernd Will. This article is licensed under GNU Free Documentation License. |
