Concept"
(→Trivia) |
|||
| (2 intermediate revisions by the same user not shown) | |||
| Line 20: | Line 20: | ||
This is a typical scenario when you work with business data, and this is where a pivot table comes into play. | This is a typical scenario when you work with business data, and this is where a pivot table comes into play. | ||
| − | For example, you can let Pivottable sums up all the selling prices per agent, per airline, and arrange agents on the row, airline on the column, then you automatically have the desired data summary on Antonio's row. | + | For example, you can let ZK Pivottable sums up all the selling prices per agent, per airline, and arrange agents on the row, airline on the column, then you automatically have the desired data summary on Antonio's row. |
[[Image: ZKPivotEsn_work_pivot_03.png]] | [[Image: ZKPivotEsn_work_pivot_03.png]] | ||
| Line 28: | Line 28: | ||
[[Image: ZKPivotEsn_work_pivot_06.png]] | [[Image: ZKPivotEsn_work_pivot_06.png]] | ||
| − | We call ''Agent, Airline'' and ''Price'' '''fields''', and more precisely speaking, ''Agent'' is a '''row field''', ''Airline'' is a '''column field''', and ''Price'' is a '''data field'''. | + | We call ''Agent, Airline'' and ''Price'' '''fields''', and more precisely speaking, ''Agent'' is a '''row field''', ''Airline'' is a '''column field''', and ''Price'' is a '''data field'''. |
| − | |||
| − | |||
==Row and column headers== | ==Row and column headers== | ||
| Line 81: | Line 79: | ||
[[Image: ZKPivotEsn_work_pivot_08.png]] | [[Image: ZKPivotEsn_work_pivot_08.png]] | ||
| − | The six regions defined above cover all the areas in a Pivottable except paging and scroll bar. Each of data title, row title, and column title is also called a '''title cell'''. | + | The six regions defined above cover all the areas in a Pivottable except paging and scroll bar. |
| + | * Each of data title, row title, and column title is also called a '''title cell'''. | ||
| + | * A cell in data area is called a '''data cell'''. | ||
==Version History== | ==Version History== | ||
Latest revision as of 07:20, 31 March 2011
If you are not familiar with the concept of pivot table, this section will kindly guide you through.
The Basic
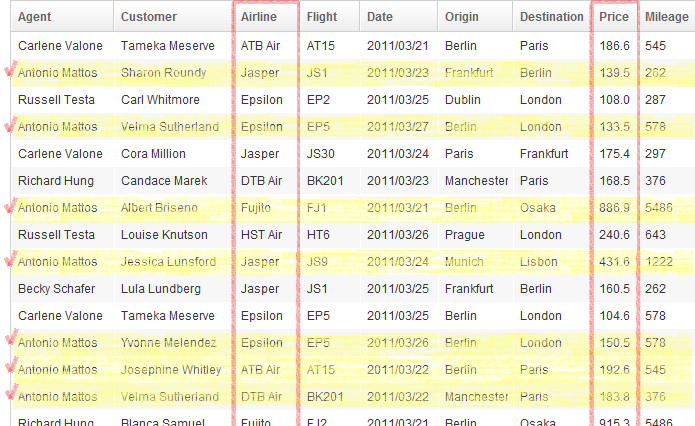
Suppose you have a table of data of flight ticket sales record like this,
and someone asks you "Hey, how did Antonio do this week? How much did he sell from each airline?"
You read through the table, highlight all entries with Antonio involved, categorize them by airlines, and sum up the selling prices.
This is a typical scenario when you work with business data, and this is where a pivot table comes into play.
For example, you can let ZK Pivottable sums up all the selling prices per agent, per airline, and arrange agents on the row, airline on the column, then you automatically have the desired data summary on Antonio's row.
Taking a closer look, the number in each cell comes from summing up the values of all price entries of given agent and airline:
We call Agent, Airline and Price fields, and more precisely speaking, Agent is a row field, Airline is a column field, and Price is a data field.
Row and column headers
The computer screen is 2-dimensional after all, so what if we want to summarize data by more than 2 criteria?
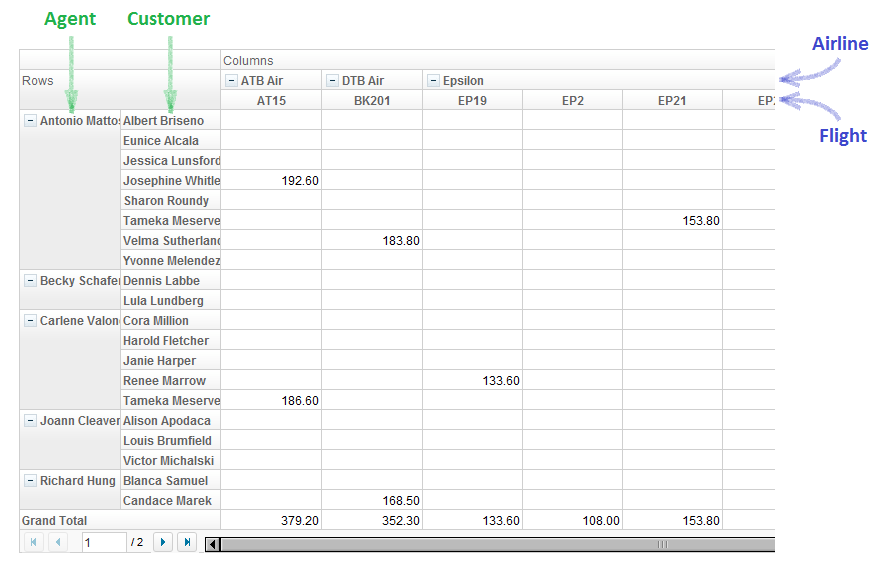
Pivottable can accept multiple fields on columns and rows. You can think of it as Auxheaders of Grid. For example, if you want to have Agent and Customer on the rows, Airline and Flight on the columns, this is what you will get:
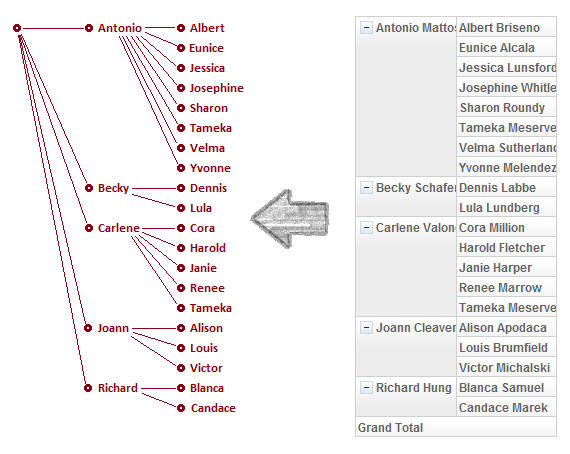
You can also think of row and column fields as categorization layers of data. On the X dimension, the data are categorized firstly by Airline, then by Flight. While on the Y dimension, they are categorized by Agent then Customer. Each of these two categories (row and column) has a tree structure. We call them row header tree and column header tree, respectively.
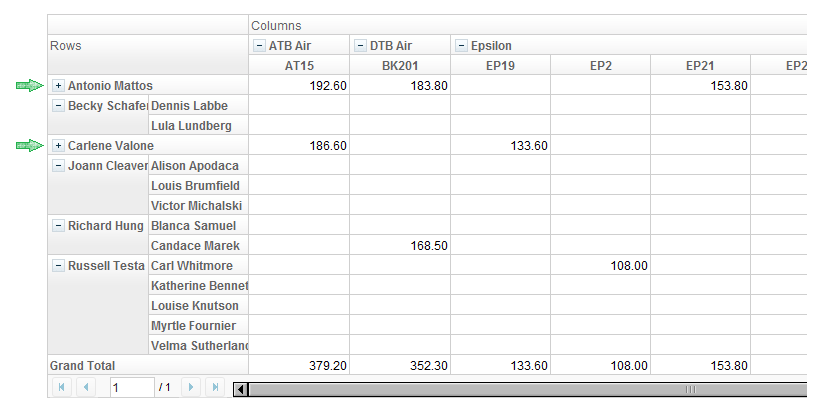
In addition, it is quite easy to imagine, if you click on the minus sign on any of the row or column header node, you can close the node so the data will be contracted into a single row or column.
Data fields
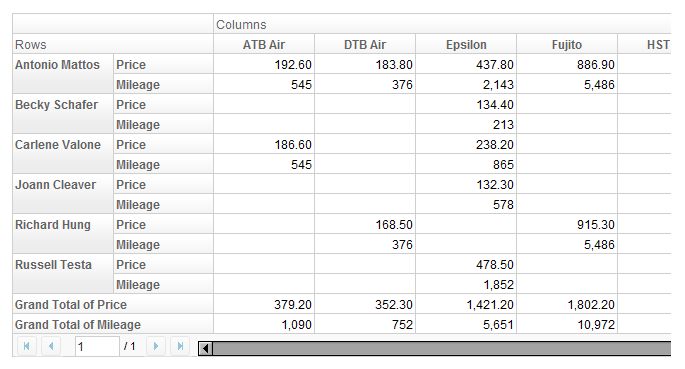
We can have multiple row fields and column fields in a Pivottable, so how about data fields? Yes, we can surely have more than one data fields. Suppose we have Price and Mileage as data fields, you will see:
By default, the data fields are displayed by column, but you can also have them arranged on rows.
We call this property data field orientation, or data orientation in short. In the former case, the data orientation is "column", while in the latter, it is "row".
Summary and subtotal
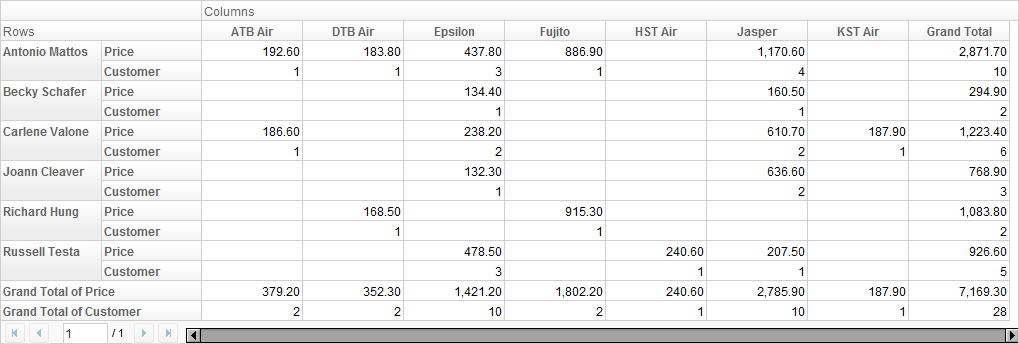
So far we have seen Price and Mileage as data fields, and the data cell values are sums of a subset from raw data. What if a data field is not numeric? How can we sum them up? In this case, Pivottable is smart enough to replace the concept of Sum by Count. For example, if you put Price and Customer as data fields, you will see:
Thus, to be generic, rather than calling the displayed values "sum", we call them summary, which could be a sum, a count, or even anything defined by user.
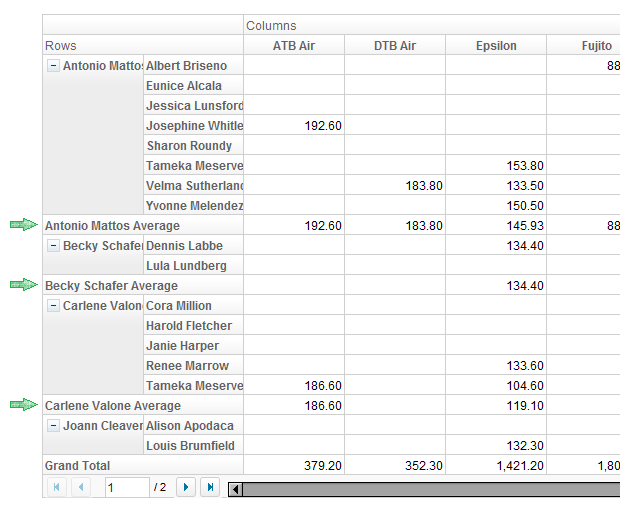
In additional to changing summary, we can also attach a row or column for subtotal on each header node. For example, if we let Agent and Customer be row fields, and want a subtotal of as Average on Agent layer, we will see:
Trivia
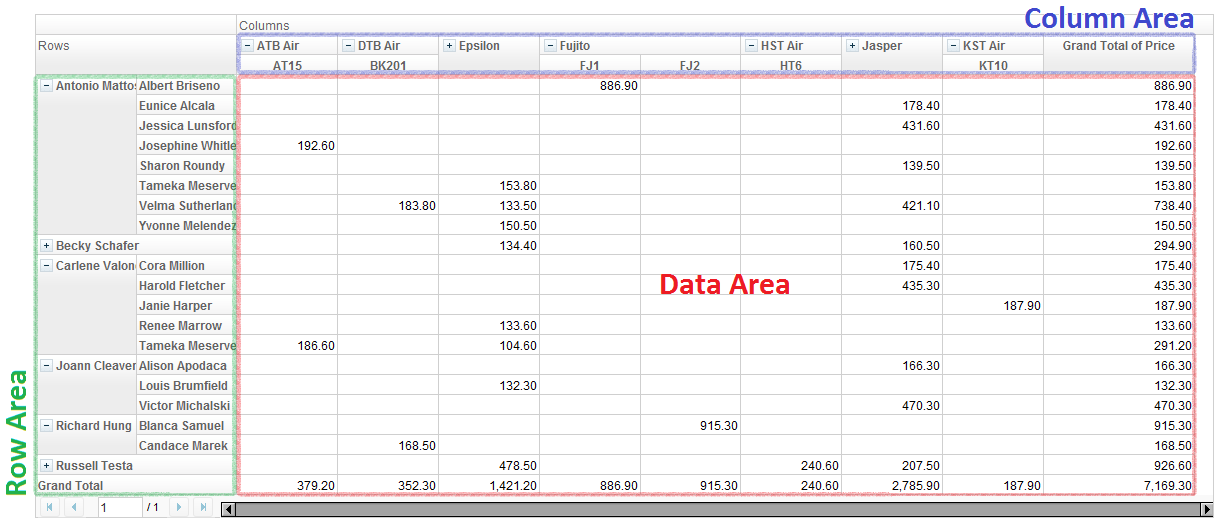
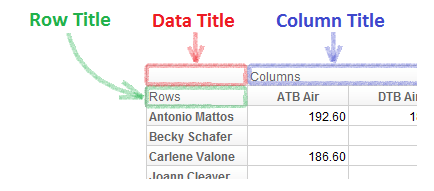
For a better reading experience throughout the rest of this books, we also define the follow terms: data area, row area, column area, data title, row title, and column title.
The six regions defined above cover all the areas in a Pivottable except paging and scroll bar.
- Each of data title, row title, and column title is also called a title cell.
- A cell in data area is called a data cell.
Version History
| Version | Date | Content |
|---|---|---|

