ZHighCharts: Integrating ZK with Highcharts"
m (→Demo) |
|||
| Line 20: | Line 20: | ||
==Component Usage== | ==Component Usage== | ||
To create a chart, four steps are required: | To create a chart, four steps are required: | ||
| − | + | <ol> | |
| − | + | <li> Add '''zhighcharts-0.2.0.jar''' to the directory '''WEB-INF/lib'''</li> | |
| + | <li>Add the ZHighCharts component to the ZUL file</li> | ||
<source> | <source> | ||
<zhighcharts id="chartComp" /> | <zhighcharts id="chartComp" /> | ||
</source> | </source> | ||
| − | + | <li>Initialize and configure the component in the controller</li> | |
<source> | <source> | ||
ZHighCharts chartComp; | ZHighCharts chartComp; | ||
| Line 33: | Line 34: | ||
chartComp.setType("line"); | chartComp.setType("line"); | ||
</source> | </source> | ||
| − | + | <li>Add some data</li> | |
<source> | <source> | ||
SimpleExtXYModel dataChartModel = new SimpleExtXYModel(); | SimpleExtXYModel dataChartModel = new SimpleExtXYModel(); | ||
| Line 44: | Line 45: | ||
dataChartModel.addValue("Chart 1", 3, 5); | dataChartModel.addValue("Chart 1", 3, 5); | ||
</source> | </source> | ||
| + | |||
==License== | ==License== | ||
The ZHighCharts project is hosted on github [https://github.com/NGI-Maghreb/ZK/ here]. To use ZHighCharts, a valid Highcharts license is required. | The ZHighCharts project is hosted on github [https://github.com/NGI-Maghreb/ZK/ here]. To use ZHighCharts, a valid Highcharts license is required. | ||
Revision as of 08:02, 19 November 2012
Alain Galdemas & Zied Zaim @NGI Maghreb
November 19, 2012
Applicable to ZK 5.0 and later
Introduction
The best way to graphically represent data is to draw charts. ZK supports a few type of charts based on JFreeChart library. In this small talk, I will introduce a new component - ZHighCharts, based on Highcharts JS library which offers an easy way for users to create modern and intuitive charts.
Demo
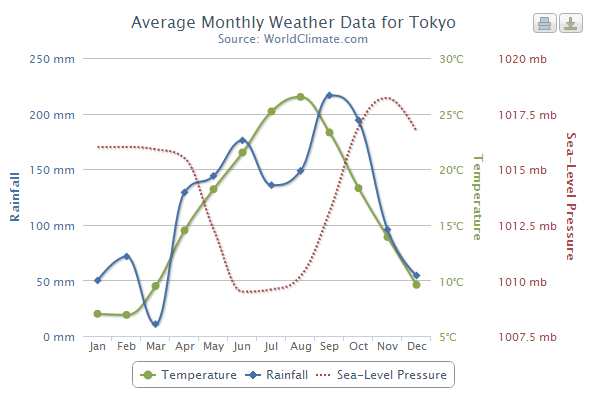
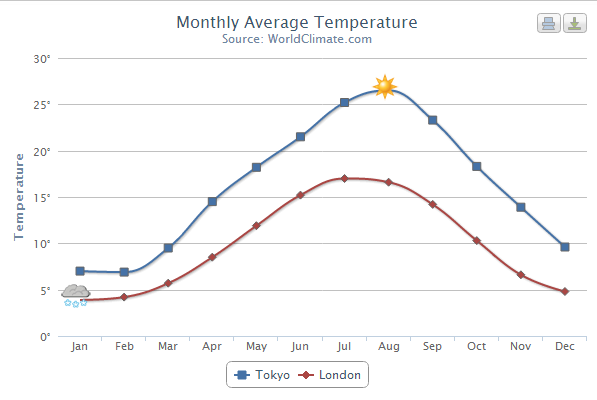
Here are some selected demos:
More demos are available here: http://zhighcharts.appspot.com/demo.zul
Component Usage
To create a chart, four steps are required:
- Add zhighcharts-0.2.0.jar to the directory WEB-INF/lib
- Add the ZHighCharts component to the ZUL file
- Initialize and configure the component in the controller
- Add some data
<zhighcharts id="chartComp" />ZHighCharts chartComp;
chartComp = (ZHighCharts) getFellow("chartComp");
chartComp.setTitle("My first ZHighChart chart");
chartComp.setType("line");SimpleExtXYModel dataChartModel = new SimpleExtXYModel();
chartComp.setModel(dataChartModel);
dataChartModel.addValue("Chart 1", 0, 7);
dataChartModel.addValue("Chart 1", 1, 4);
dataChartModel.addValue("Chart 1", 2, 9);
dataChartModel.addValue("Chart 1", 3, 5);License
The ZHighCharts project is hosted on github here. To use ZHighCharts, a valid Highcharts license is required. Note the use of Highcharts is free for non-profit organizations, students, universities, public schools and non-commercial personal websites. To use ZHighCharts for commercial services, a valid Highcharts license is required.
More informations are available on this link: Highcharts JS Licence.
Summary
Highcharts JS is considered as one of the best charting library written in JavaScript. The ZHighCharts project is trying to provide a pure Java approach to use Highcharts JS on ZK projects.
Comments
| Copyright © NGI Maghreb. This article is licensed under GNU Free Documentation License. |

