Chart"
From Documentation
| Line 130: | Line 130: | ||
'''Description:''' Denotes user has clicked the component. | '''Description:''' Denotes user has clicked the component. | ||
| − | Use < | + | Use <javadoc method="getX()">org.zkoss.zk.ui.event.MouseEvent</code> and <javadoc method="getY()">org.zkoss.zk.ui.event.MouseEvent</code> method to get coordinates. |
| − | Use < | + | Use <javadoc method="getAreaComponent()">org.zkoss.zk.ui.event.MouseEvent</code> method to get the UUID of the area component which user clicks on. |
<source lang="java"> | <source lang="java"> | ||
Revision as of 04:56, 12 August 2010
Chart
Employment/Purpose
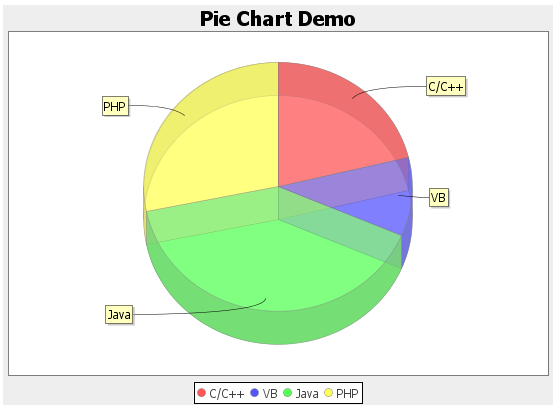
A chart is used to show a set of data as a graph. It helps users to judge things with a snapshot. To use a chart component , developers must prepare a ChartModel and a ChartEngine. Developers also set proper chart type, and the threeD (3D) attribute to draw proper chart. The model and type must match to each other; or the result is unpredictable. The 3D chart is not supported on all chart type.
Example
| PieModel | ||
| PieModel | ||
| CategoryModel | ||
| CategoryModel or XYModel | ||
| CategoryModel or XYModel | ||
| CategoryModel | ||
| CategoryModel or XYModel | ||
| CategoryModel | ||
| XYModel | ||
| XYModel | ||
| XYModel | ||
| XYModel | ||
| XYModel | ||
| XYModel | ||
| XYModel | ||
| HiLoModel | ||
| HiLoModel |
<vbox>
     <chart id="mychart" title="Pie Chart Demo" width="500" height="250" type="pie" threeD="true" fgAlpha="128"/>
     <zscript>
         PieModel model = new MyPieModel();
         mychart.setModel(model);
     </zscript>
 </vbox>
Supported events
