Flashchart"
From Documentation
| Line 65: | Line 65: | ||
</source> | </source> | ||
| − | =Supported | + | =Supported Events= |
{| border="1" | width="100%" | {| border="1" | width="100%" | ||
| Line 74: | Line 74: | ||
| None | | None | ||
|} | |} | ||
| + | *Inherited Supported Events: [[ZK_Component_Reference/Multimedia_and_Miscellaneous/Flash#Supported_Events | Flash]] | ||
=Supported Children= | =Supported Children= | ||
Revision as of 04:49, 23 November 2010
Flashchart
- Demonstration: link
- Java API: Flashchart
- JavaScript API: Flashchart
Employment/Purpose
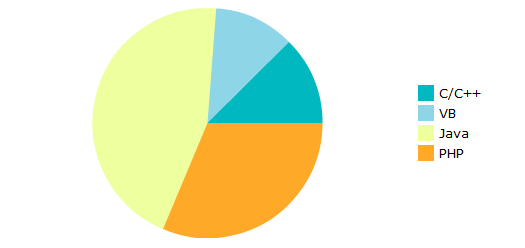
The generic flash chart component.
Example
<vbox>
<grid width="400px">
<columns>
<column label="category" width="150px" />
<column label="value" />
</columns>
<rows>
<row>
<label id="c0" value="C/C++" />
<decimalbox id="v0" value="21.2" constraint="no empty"
onChange="update(0)" />
</row>
<row>
<label id="c1" value="VB" />
<decimalbox id="v1" value="10.2" constraint="no empty"
onChange="update(1)" />
</row>
<row>
<label id="c2" value="Java" />
<decimalbox id="v2" value="40.4" constraint="no empty"
onChange="update(2)" />
</row>
<row>
<label id="c3" value="PHP" />
<decimalbox id="v3" value="28.2" constraint="no empty"
onChange="update(3)" />
</row>
</rows>
</grid>
<flashchart id="mychart" width="500" height="250"
type="pie">
<zscript>
void update(int rowIndex) {
Label lb = (Label) self.getFellow("c"+rowIndex);
Decimalbox db = (Decimalbox) self.getFellow("v"+rowIndex);
model.setValue(lb.value, new Double(db.getValue().doubleValue()));
}
PieModel model = new SimplePieModel();
for(int j=0; j < 4; ++j) {
update(j);
}
mychart.setModel(model);
</zscript>
</flashchart>
<toolbarbutton label="See More chart..." href="/userguide/data/moreflashchart.zul" target="zkdemo"/>
</vbox>
Supported Events
| None | None |
- Inherited Supported Events: Flash
Supported Children
*ALL
Use cases
| Version | Description | Example Location |
|---|---|---|
Version History
| Version | Date | Content |
|---|---|---|
