Add Chart"
From Documentation
(1st Draft) |
|||
| Line 51: | Line 51: | ||
| 2.2.0 | | 2.2.0 | ||
| Oct. 28, 2011 | | Oct. 28, 2011 | ||
| − | | | + | | API to insert a chart |
|- | |- | ||
| | | | ||
Revision as of 08:13, 28 October 2011
Available in ZK Spreadsheet EE only
Purpose
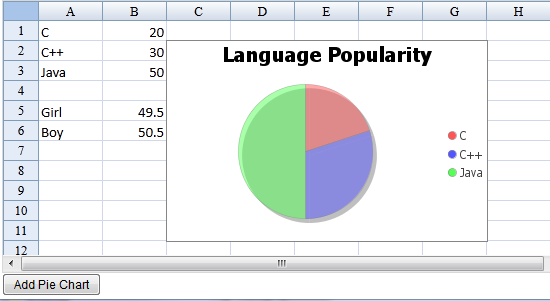
ZK Spreadsheet uses Range.addChart (usermodel, ChartData, ChartGrouping, LegendPosition) to insert a new chart into the sheet.
ZUML
<window vflex="1" width="100%"  apply="org.zkoss.zssessentials.config.AddChartComposer">
    <spreadsheet id="myss" src="/WEB-INF/excel/config/addChart.xlsx" maxrows="200"
        maxcolumns="40" vflex="1" width="100%">
    </spreadsheet>
    <button id="add" label="Add Pie Chart"/>
</window>
Composer
We use onClick button to trigger insert a pie chart into the sheet. User has to specify the PicChartData and where to anchor the chart in the sheet.
	private Spreadsheet myss;

	public void onClick$add(MouseEvent evt) {
		//add a pie chart
		Worksheet sheet = myss.getSelectedSheet();
		Range rng = Ranges.range(sheet);

		ClientAnchor anchor = new XSSFClientAnchor(0, 0, 0, 0, 2, 1, 7, 11); //C2:H12
		XSSFPieChartData data = new XSSFPieChartData();

		ChartTextSource title = DataSources.fromString("Language Popularity");
		ChartDataSource<String> cats = DataSources.fromStringCellRange(sheet, CellRangeAddress.valueOf("A1:A3"));
		ChartDataSource<Number> vals = DataSources.fromNumericCellRange(sheet, CellRangeAddress.valueOf("B1:B3"));
		data.addSerie(title, cats, vals);
		rng.addChart(anchor, data, ChartType.Pie, ChartGrouping.STANDARD, LegendPosition.RIGHT);
	}
View the complete source of ZUML addChart.zul
View the complete source of composer AddChartComposer.java
Version History
| Version | Date | Content |
|---|---|---|
| 2.2.0 | Oct. 28, 2011 | API to insert a chart |
All source code listed in this book is at Github.
