A ZK Performance Monitor"
m (→Download) |
|||
| Line 44: | Line 44: | ||
==1. Download Files== | ==1. Download Files== | ||
| − | *copy | + | *copy monitor.jar file to ./WEB-INF/lib |
| − | [ | + | ** For ZK 5 download from [http://sourceforge.net/projects/zkforge/files/Small%20Talks/Performance%20Meter%20Tool/monitor.jar/download sourceforge] |
| − | + | ** For ZK 6 download from [http://github.com/downloads/samchuang/monitor/monitor.jar github] | |
| − | [ | + | ** For ZK 7 download from [http://github.com/VincentJian/monitor/releases/download/0.8.0/monitor.jar github] |
| − | *copy | + | *copy the following zul files to ./ |
| − | [ | + | ** For ZK 5 and ZK 6 |
| − | [ | + | *: [http://sourceforge.net/projects/zkforge/files/Small%20Talks/Performance%20Meter%20Tool/monitor.zul/download monitor.zul], [http://sourceforge.net/projects/zkforge/files/Small%20Talks/Performance%20Meter%20Tool/stats.zul/download stats.zul], [http://sourceforge.net/projects/zkforge/files/Small%20Talks/Performance%20Meter%20Tool/barchart.zul/download barchart.zul], [http://sourceforge.net/projects/zkforge/files/Small%20Talks/Performance%20Meter%20Tool/piechart.zul/download piechart.zul] |
| − | [ | + | ** For ZK 7 |
| − | [ | + | *: [http://github.com/VincentJian/monitor/releases/download/0.8.0/monitor.zul monitor.zul], [http://github.com/VincentJian/monitor/releases/download/0.8.0/stats.zul stats.zul], [http://github.com/VincentJian/monitor/releases/download/0.8.0/barchart.zul barchart.zul], [http://github.com/VincentJian/monitor/releases/download/0.8.0/piechart.zul piechart.zul] |
| − | |||
| − | |||
| − | |||
==2. Register Listeners== | ==2. Register Listeners== | ||
Revision as of 07:17, 22 October 2014
Sam Chuang, Engineer, Potix Corporation
January 5, 2010
Applicable to ZK 3.6 and later
Introduction
ZK was among the first Ajax frameworks to introduce a performance meter utility for monitoring Ajax applications. A performance test provides us with the knowledge of whether the application meets the performance criteria, such as server response time, or the rendering time on browsers, which helps us in determining a web application's reliability and scalability. In this Small talk, an implementation of ZK's Performance Meter interface is illustrated.
ZK's Performance Meter Interface
The [Javadoc Error! type should either be a class or an interface] interface provides timestamped information in different stages of a request. The figure below shows the stages in a request.
The interface defines five functions. Using these functions, we could get a timestamp in each stage of request cycle.
- Figure: This is a graphical representation of a complete ZK request cycle.
- T1: requestStartAtClient (java.lang.String requestId, Execution exec, long time)
- T2: requestStartAtServer(java.lang.String requestId, Execution exec, long time)
- T3: requestCompleteAtServer(java.lang.String requestId, Execution exec, long time)
- T4: requestReceiveAtClient(java.lang.String requestId, Execution exec, long time)
- T5: requestCompleteAtClient(java.lang.String requestId, Execution exec, long time)
Note: Each request has a unique id called requestId, which distinguishes one request from another.
Define time period by request stages
- Server Execution time: T3 - T2
- Client Execution time: T5 - T4
- Network Latency time: (T4 - T3) + (T2 - T1)
Note
- About request time period: when we make a connection to a page for the first time, only Server Execution time is available. The Client Execution time period is saved on the client side, which will not be made available on the server side until the data is sent to the server along with the next request.
- Statistics record store on session use attribute name org.zkoss.zkdemo.monitor.PerformanceCtrl.METER_STATUS and org.zkoss.zkdemo.monitor.RequestMonitor.REQUEST
For more information, please also refer to a previous contribution by Jiri Bubnik: Performance Monitoring of ZK Application
A Demo of Performance Meter Implementation
Here is an implementation of the Performance Meter interface. (If the video is shown clipped, right-click and select "show all".)
Running the Demo
1. Download Files
- copy monitor.jar file to ./WEB-INF/lib
- For ZK 5 download from sourceforge
- For ZK 6 download from github
- For ZK 7 download from github
- copy the following zul files to ./
- For ZK 5 and ZK 6
- For ZK 7
2. Register Listeners
In zk.xml, register two listeners to ZK
<?xml version="1.0" encoding="UTF-8"?>
<zk>
	<listener>
		<description>Monitor the statistic</description>
		<listener-class>org.zkoss.zk.ui.util.Statistic</listener-class>
	</listener>
	<listener>
              <description>ZK performance monitor</description>
              <listener-class>org.zkoss.zkdemo.monitor.PerformanceMeter</listener-class>
	</listener>
</zk>
3.Monitor Performance
Open monitor.zul in your browser to view data
Show Each Request's Average Time
- 1. Click Refresh to list the data
- Note: Each request made to the server is recorded, and the average time and time percentage in each stages are calculated.
Show Monitored Data
- 1. Click Start to start monitoring request data in session
- 2. Click Refresh to update and display data
- 3. Click Stop to stop monitoring request data in session
- Note: This table shows each request made to the server in a session; each request interval is kept and may be selected for comparisons.
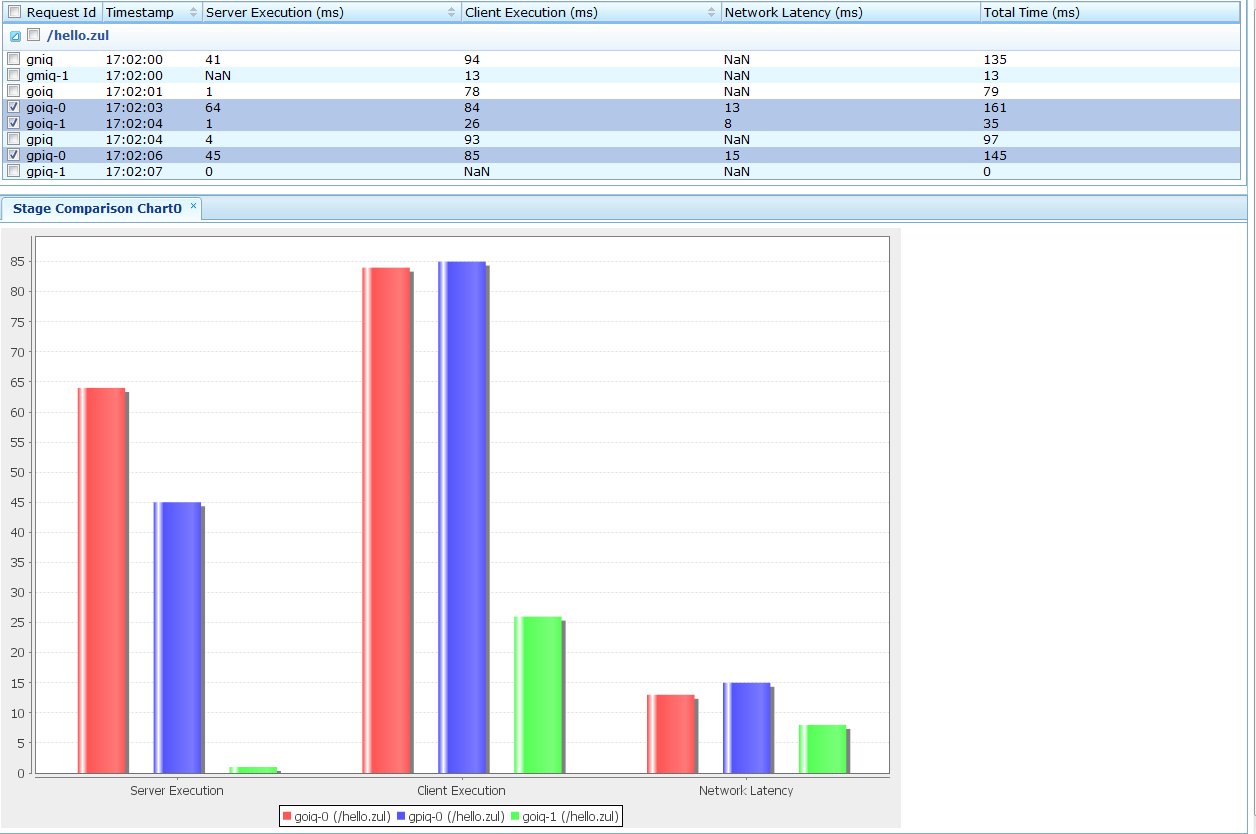
Stage Comparison Chart
- 1. Select rows in the grid.
- 2. Click Stage Comparison Chart to draw
- Note: This chart compares each selected row (request) in different stages.
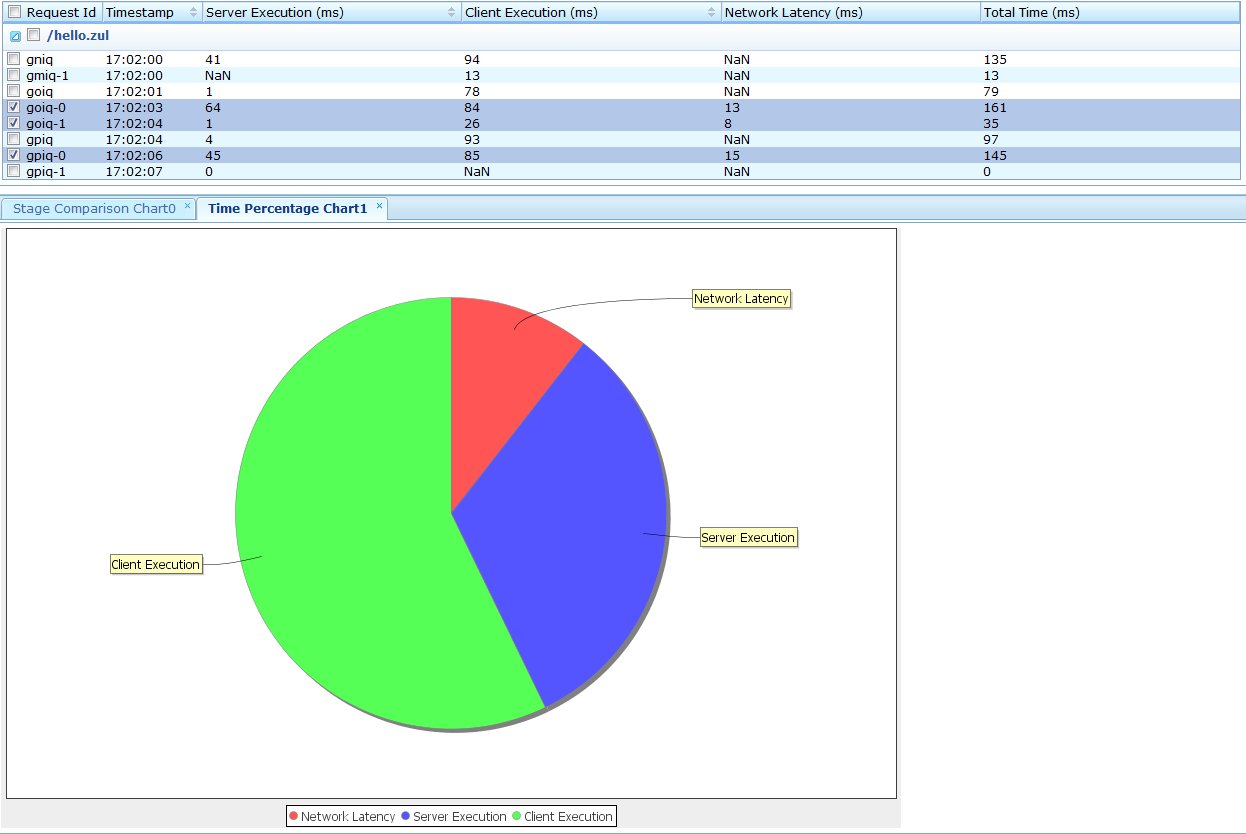
Time Percentage Chart
- 1. Select rows in the grid.
- 2. Click Time Percentage Chart to draw
- Note: This chart compare time percentage
Server Statistics
- Click Reload to list data
- Note:This grid shows the number of "Sessions", "Desktops" and "Updates".
Download
- download ZK 5 monitor war file
- download ZK 6 monitor war file
- download ZK 7 monitor war file
- source code
Summary
Performance is a critical factor to a web application. The Performance Meter utility allows us to determine the request execution time, compare the results, and identify the bottleneck with ease.
If you have any problems, please feel free to post on the ZK forum.
Comments
| Copyright © Potix Corporation. This article is licensed under GNU Free Documentation License. |


