Columnlayout
From Documentation
Columnlayout
- Demonstration: Columnlayout
- Java API: Columnlayout
- JavaScript API: Columnlayout
- Style Guide: Columnlayout
- Available for ZK:
-

Employment/Purpose
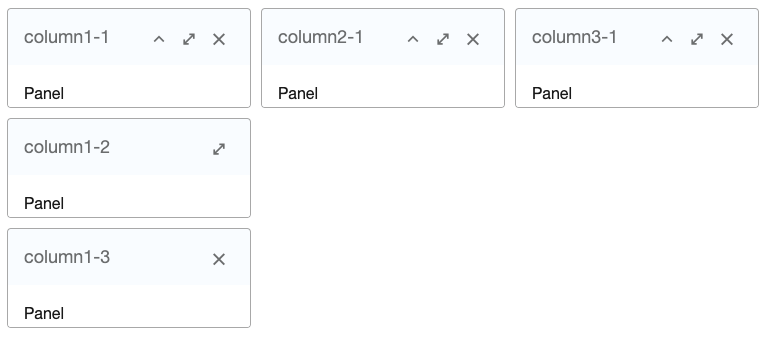
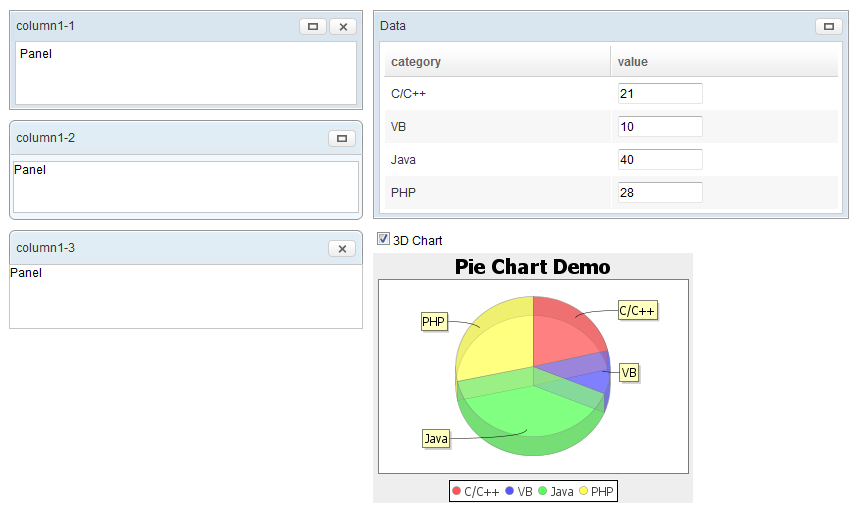
A columnlayout is a layout which can have multiple columns, and each column may have any number of panels placed vertically with different height. When using Columnlayout, you have to assign width (either percent or pixel) on every Columnchildren, or the result might depend on the browser and not as expected.
[since 6.0.0]
Each column may have any number of any type of components.
Example
<columnlayout>
    <columnchildren width="30%" style="padding: 5px">
        <panel height="100px" title="column1-1" closable="true" collapsible="true"
            border="normal" maximizable="true" style="margin-bottom:10px">
            <panelchildren>Panel</panelchildren>
        </panel>
        <panel height="100px" framable="true" title="column1-2"
            border="normal" maximizable="true" style="margin-bottom:10px">
            <panelchildren>Panel</panelchildren>
        </panel>
        <panel height="100px" title="column1-3" border="normal"
            closable="true">
            <panelchildren>Panel</panelchildren>
        </panel>
    </columnchildren>
    <columnchildren width="40%" style="padding: 5px">
        <panel title="Data" maximizable="true" border="normal"
            style="margin-bottom:10px">
            <panelchildren>
                <grid fixedLayout="true" style="border:0px"
                    height="100%">
                    <columns>
                        <column label="category" />
                        <column label="value" />
                    </columns>
                    <rows>
                        <row>
                            <label id="c0" value="C/C++" />
                            <decimalbox id="v0"
                                value="21." constraint="no empty" onChange="update(0)" />
                        </row>
                        <row>
                            <label id="c1" value="VB" />
                            <decimalbox id="v1"
                                value="10." constraint="no empty" onChange="update(1)" />
                        </row>
                        <row>
                            <label id="c2" value="Java" />
                            <decimalbox id="v2"
                                value="40." constraint="no empty" onChange="update(2)" />
                        </row>
                        <row>
                            <label id="c3" value="PHP" />
                            <decimalbox id="v3"
                                value="28." constraint="no empty" onChange="update(3)" />
                        </row>
                    </rows>
                </grid>
            </panelchildren>
        </panel>
        <panel border="normal">
            <panelchildren>
                <checkbox label="3D Chart" checked="true"
                    onCheck="mychart.setThreeD(self.isChecked())" />
                <chart id="mychart" title="Pie Chart Demo"
                    width="320px" type="pie" threeD="true" fgAlpha="128">
                    <attribute name="onClick"><![CDATA[
                        String areaid = event.getArea();
                        if (areaid != null) {
                            Area area = self.getFellow(areaid);
                            alert("" + area.getAttribute("entity") + ":" + area.getTooltiptext());
                        }
                    ]]></attribute>
                    <zscript><![CDATA[
                        void update(int rowIndex) {
                            Label lb = (Label) self.getFellow("c" + rowIndex);
                            Decimalbox db = (Decimalbox) self.getFellow("v" + rowIndex);
                            model.setValue(lb.value, new Double(db.getValue().doubleValue()));
                        }
                        PieModel model = new SimplePieModel();
                        for (int j = 0; j < 4; ++j) {
                            update(j);
                        }
                        mychart.setModel(model);
                    ]]></zscript>
                </chart>
            </panelchildren>
        </panel>
    </columnchildren>
</columnlayout>
[since 6.0.0]
Each column may have any number of any type of components.
<columnlayout>
	<columnchildren width="30%" style="padding: 5px">
		<window height="100px" title="column1-1" closable="true"
			border="normal" maximizable="true" style="margin-bottom:10px">
			Panel
		</window>
		<panel height="100px" framable="true" title="column1-2"
			border="normal" maximizable="true" style="margin-bottom:10px">
			<panelchildren>Panel</panelchildren>
		</panel>
		<panel height="100px" title="column1-3" border="normal"
			closable="true">
			<panelchildren>Panel</panelchildren>
		</panel>
	</columnchildren>
	<columnchildren width="40%" style="padding: 5px">
		<window id="dataWin" title="Data" maximizable="true" border="normal"
			style="margin-bottom:10px">
			<grid fixedLayout="true" style="border:0px"
				height="100%">
				<columns>
					<column label="category" />
					<column label="value" />
				</columns>
				<rows>
					<row>
						<label id="c0" value="C/C++" />
						<decimalbox id="v0"
							value="21." constraint="no empty" onChange="update(0)" />
					</row>
					<row>
						<label id="c1" value="VB" />
						<decimalbox id="v1"
							value="10." constraint="no empty" onChange="update(1)" />
					</row>
					<row>
						<label id="c2" value="Java" />
						<decimalbox id="v2"
							value="40." constraint="no empty" onChange="update(2)" />
					</row>
					<row>
						<label id="c3" value="PHP" />
						<decimalbox id="v3"
							value="28." constraint="no empty" onChange="update(3)" />
					</row>
				</rows>
			</grid>
		</window>
		<vbox>
			<checkbox label="3D Chart" checked="true"
				onCheck="mychart.setThreeD(self.isChecked())" />
			<chart id="mychart" title="Pie Chart Demo"
				width="320px" type="pie" threeD="true" fgAlpha="128">
				<attribute name="onClick"><![CDATA[
					String areaid = event.getArea();
					if (areaid != null) {
						Area area = self.getFellow(areaid);
						alert("" + area.getAttribute("entity") + ":" + area.getTooltiptext());
					}
				]]></attribute>
				<zscript><![CDATA[
					void update(int rowIndex) {
						Window dataWin = self.getParent().getParent().getFellow("dataWin");
						Label lb = (Label) dataWin.getFellow("c" + rowIndex);
						Decimalbox db = (Decimalbox) dataWin.getFellow("v" + rowIndex);
						model.setValue(lb.value, new Double(db.getValue().doubleValue()));
					}
					PieModel model = new SimplePieModel();
					for (int j = 0; j < 4; ++j) {
						update(j);
					}
					mychart.setModel(model);
				]]></zscript>
			</chart>
		</vbox>
	</columnchildren>
</columnlayout>
Supported Events
| None | None |
- Inherited Supported Events: XulElement
Supported Children
Use Cases
| Version | Description | Example Location |
|---|---|---|
Version History
| Version | Date | Content |
|---|---|---|

