Step by Step Trouble Shooting
Performance SOP
This article tries to provide general steps and details how to determine a bottleneck in a slow performing ZK application. Additionally it offers some conclusions and tips, what the next steps would be after identifying the problem area.
Identify the Bottleneck
Usually the bottleneck can be found in one of these areas:
- client
- network
- server
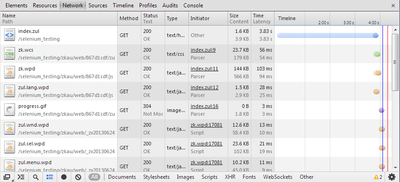
To breakdown a slow performing web application is a good idea to start, where the bad performance is perceived... in the browser. Most modern browsers provide very sophisticated tools supporting the search for a bottleneck and draw some conclusions, and eliminate other possible causes easily.
- Developer tools - Net(work)
- Chrome -> [F12] / [CTRL + SHIFT + I]
- Firefox -> [CTRL + SHIFT + Q]
- Firefox with Firebug -> [F12]
- IE9+ -> [F12]
- IE8 & others -> fiddler2
Investigating the network traffic by following the questions below the biggest problem area(s) should become apparent after a few minutes:
1. Are there one or more long running requests?
NO → #Client Side Issue
YES
↓
2. Is it a static resource?
YES (js, css, images...) → check #ZK Server Configuration (debug / cache / compression) → STILL SLOW → #Network Issue
NO (dynamic request into ZK application)
- *.zul = full page request (can be followed by ajax requests)
- zkau/* = ajax request
↓
3. Which PHASE of the request is slowest ? (wording based on Chrome developer tools)
CONNECTING (or one of Proxy, DNS Lookup, Blocking, SSL)
- 3.a) Is this a network problem (everything between browser and ZK Application)?
- test ping / trace route to different servers
- test dns lookup timing
- YES → #Network Issue
- NO → #Server Side Issue (application takes long time to accept connection, or even times out)
SENDING
- 3.b) Is the request unreasonably big? (rare case, usually due to an upload (reasonable), or form posting a lot of data)
- YES → #Client Side Issue
- NO
- ↓
- 3.c) Is the bandwidth low?
- e.g. try upload the same amount of data to the server via ftp/scp to check possible upload speed
- YES → #Network Issue
- NO → #Server Side Issue (application server receiving request data slowly)
WAITING → #Server Side Issue (application server taking long time to prepare response)
RECEIVING
- 3.d) Is the response unreasonably big?
- YES → #ZK Server Configuration (render on demand / compression)
- NO
- ↓
- 3.e) Is the bandwidth low?
- e.g.try to download the same amount of data from the server via ftp/scp to check download speed
- YES → ask your administrator to fix it ;)
- NO → #Server Side Issue (appserver sending response data slowly)
Client Side Issue
If there is no significant time spend on the Network and Server side, the slowdown must happen somewhere on the client side.
Client side performance is affected my many factors and may vary with different browser types versions. Other factors are:
- operating system
- available memory
- CPU speed / load
- screen resolution
- graphics card speed
So it is good to compare the client performance on different computers with different browsers, to identify the configuration causing the issue.
If client performance among configurations / browsers is equally bad, the issue will more likely be found in the Rendering area → #Client Side Profiling
Once you identified the client side rendering takes very long, check the size of the response, if the Client engine needs to render a lot (e.g. a Grid with 1000 lines) it will take its time. So compare the timing with a smaller response, and consider if this can be prevented by reducing the data sent to the client using Render on Demand or Pagination (Most users don't need 1000 lines visible at once)
Performance degrading over time when using the application (while network and server timings remain constant) might indicate a client side memory leak → #Client Memory Issue
Client Side Profiling
Make sure your local computer is not under heavy CPU load, and has "enough" Memory available, before starting to profile the Javascript execution in the browser.
To measure and break down the time spent in the JS engine you can try the following steps (in chrome), and interpret the results:
- switch to the "profiles"-tab
- choose "Collect Javascript CPU Profile"
- click "start"
- perform your action e.g. reload the screen, or load the search results
- click "stop"
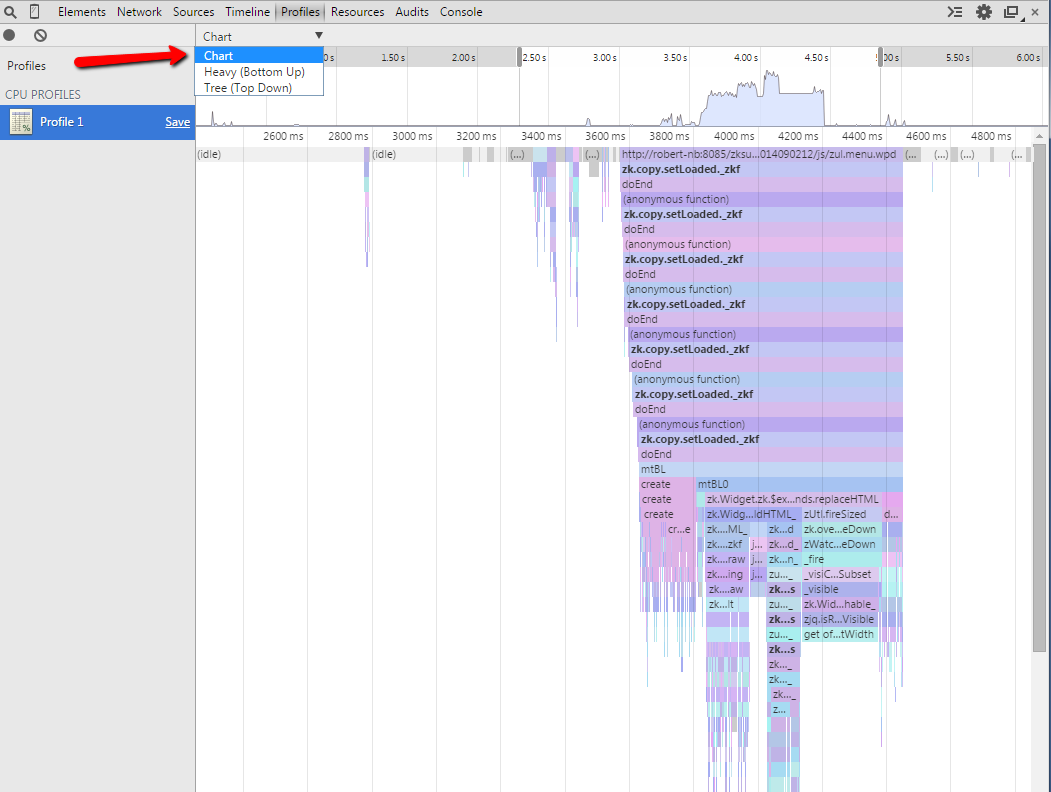
- switch to "Flame Chart" (choice at the bottom)
You'll get a nice view like this:
This brilliant visualization of the JS execution flow and stack depth can be used / interpreted in many ways to extract the information you require.
The timeline on the top indicates the whole period between "start" and "stop", I selected the range we are interested in, and the colorful area at the bottom gives details about which methods are actually called and their timing (you can zoom in and out using the mouse wheel too), clicking on one method will directly lead you to the associated line in the source code (enabling debug-js will help when using this feature).
The small peak (at 1300ms) on the left side is my actual event refreshing the page. The gap until 1500ms represents the idle time of the JS engine waiting for the first response from the server, then you can follow in which order the JS files are executed and which of them consume most of the time.
Additional waiting times in the middle indicate load time of additional JS files and garbage collection times. At about 1840ms the JS engine stops meaning ZK has finished rendering the page widgets and updating the DOM elements.
We can conclude our page took about 540ms (after the initial event) to load and render in order to become available the user and here is no significant slowdown on either JS or network side.
General conclusions:
- more wider mountains → mean more JS time (e.g. ZK render time, a third party library)
- more valleys (flat lines) → mean more waiting time (mostly network, maybe also CSS formatting or other time the browser does not assign to the JS engine)
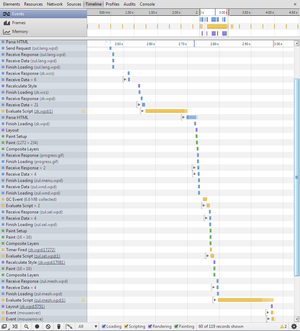
A similar but less detailed and colorful view is available in Firefox [Shift + F5] showing some basic timeline. And in IE you can also get profiling data.
I find the flame-chart in chrome most powerful, and even if the Performance issue only occurs in a different browser it is a good starting point visualize the timing of the problem, and understand the complexity of the execution path (e.g. in IE you get the information that most time is spend in method x(), and in chrome you can actually see the method in a bigger context). Or when using an older version of IE, you can define the methods of interest where to put some log statements to trace performance manually.
Client Memory Issue
Use a system management tool (e.g. on windows: task manager or process explorer) to watch the memory consumption of your browser over time.
If memory is increasing repeating an action on a page -> subsequently remove/add items from your ZUL file to identify the component causing this issue.
Again Chrome offers a memory timeline view, real time memory profiling functions and JS heap dumps.
Server Side Issue
After identifying the the server side as the bottleneck the we can drill down the problem even further.
There are many things on the server side, that can cause a slowdown, in the response. Of course you'll first check that there is enough physical memory available and that no other (unrelated) process on the server causes CPU load while you are actually idling in the ZK application.
Basically ensure that the application server has all the resources it needs and is configured to use them:
e.g.
- CPUs (multi cores)
- the server process might only have limited access to available CPU cores
- Memory
- you might have alot physical memory but the JVM is configured to only use a small value
- Incoming connections:
- application server might be configured to handle only small number of simultaneous requests even if it could handle more
- → queueing/denying additional requests exceeding these limits
- DB connection pools
- there might be a very fast DB waiting for your input, but your connection pools are too small
Then perform the "slow" operation and observe CPU load, IO times and Memory.
Busy or Waiting?
If the the CPU is almost idle but most time is spent in IO operations, then it could be a slow or very busy hard disk, or long running network operations (such as accessing external web services or querying a DB on a different host). The network or DB doesn't necessarily have to be slow, it could just be a large number of very quick calls to external resources.
E.g. 300 requests of 10ms (I would not consider slow) each, still take 3 seconds - during these 3 seconds your java process could be idly waiting for the responses and you'll see a low figure on CPU compared to a high value in IO wait times.
You'll most likely know which external resources you are accessing in your code, so commenting these out and temporarily replacing them with mock implementations will help you exclude these. If you have no idea about any continue with Server Side Profiling to identify the places that take most time when creating the response.
Here some helpful tools to determine busy or waiting processes:
Linux:
- top (in most cases just sufficient to distinguish between busy or waiting)
Windows:
- Process explorer (a better "task manager")
- Perfmon.exe (please check this tutorial about more details)
Performance Debugging/Logging/Tracing
Feeling Lucky
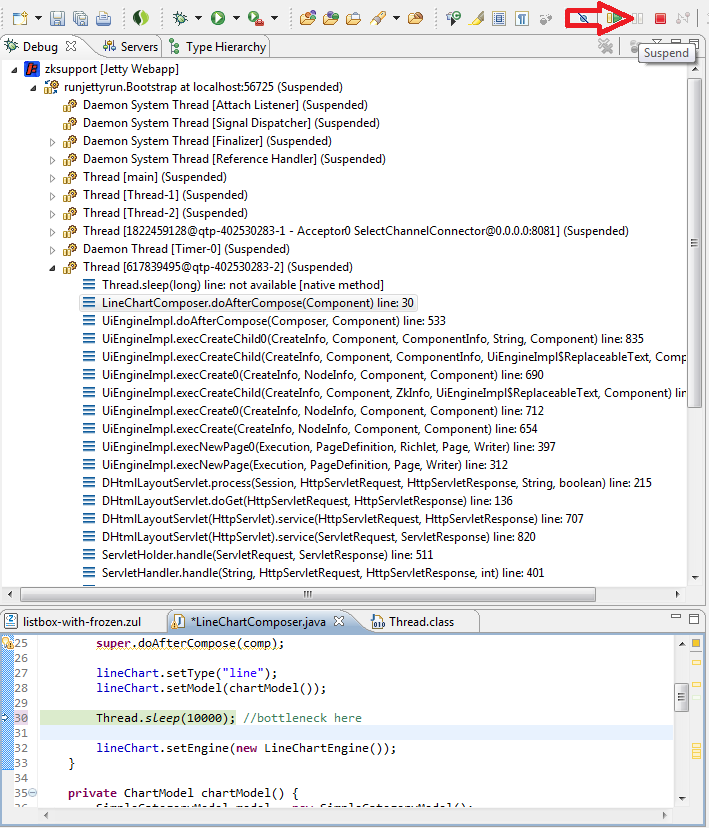
Sometimes real profiling might be overkill or you just want to make a quick test. Then a simple way to find a long running methods is to launch your server in debug mode without any break point. Then trigger the slow operation. Right in the middle of the operation, "Suspend" the execution (yes you can suspend manually without defining a break point), in your IDE. You'll have several suspended threads. Just examine their call stacks, and usually the longest stack is the one you are interested in. Then go down in the stack to search for the bottleneck (Chances are high, that you'll suspend the execution during the actual call causing the bottleneck - either it takes a long time to execute, or it is called very very often).
In eclipse a very obvious case looks might look like this:
No so lucky
In most cases the the bottleneck will not be as outstanding as in the above image, but still the call stack can be a good source to start from. e.g. outputting some counters and tracing information to the log.
Putting extra tracing logs will not always be possible and also takes implementation, building, deployment time.
So if this is not quickly possible it is better to do some sampling or profiling.
Server Side Profiling
If the JavaVM is busy during the operation or you have no idea which parts in your application consume most of the time, sampling or profiling are the final weapons.
- Sampling: analyzes the call stacks of all threads at given intervals and summarizes statistics about which methods are active most of the time
- → sufficient in most cases, will find the biggest bottlenecks at a high chance
- Profiling: gives exact more detailed timing, but this is at a cost, you should already know what you are looking for before starting the profiler
- → profiling everything might just kill the application
There are several Profiling tools in various price ranges and there is JVisualVM (included in the JDK) so it should be available everywhere.
This is a nice tutorial about how to get started with JVisualVM : Profiling with VisualVM - Part 1 and Part 2
Sampling Example usind JVisualVM
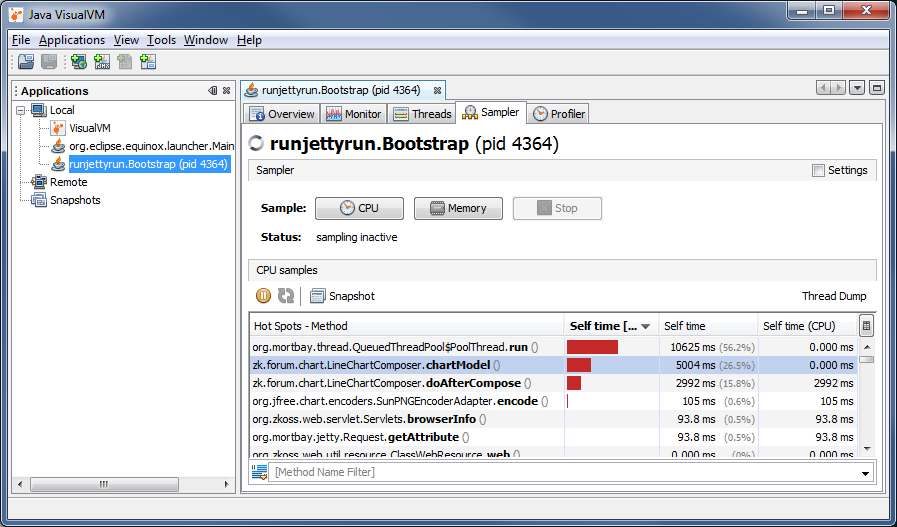
here a small example showing 2 different kinds of time performance issues (a busy loop, and a suspended thread (sleeping)):
	@Override
	public void doAfterCompose(Component comp) throws Exception {
		super.doAfterCompose(comp);

		lineChart.setType("line");
		lineChart.setModel(chartModel());

		long start = System.currentTimeMillis();
		while(System.currentTimeMillis() - start < 3000) { //bottleneck here
			StringBuilder builder = new StringBuilder();
			for(int i = 0; i < 100; i++) {
				builder.append(new String("XXX"));
			}
			builder.toString().getBytes(Charset.forName("utf-8"));
		}

		lineChart.setEngine(new LineChartEngine());
	}

	private ChartModel chartModel() throws InterruptedException {
		Thread.sleep(5000); //another bottle neck here
		SimpleCategoryModel model = new SimpleCategoryModel();

		Calendar date = Calendar.getInstance();

		for(int i = 0; i < 10; i++) {
			model.setValue("spent money", date.getTime(), Math.random() * 10000);
			date.add(Calendar.DATE, 1);
		}

		return model;
	}
When executing this slow page, it will delay the page rendering by 8 seconds, where 3 seconds will be spent in a busy loop (causing a peak on the CPU) doing some useless string building, and 5 seconds you woudn't notice on your CPU, as the thread is just sleeping.
Starting the sampler will show the actual hotspots like this.
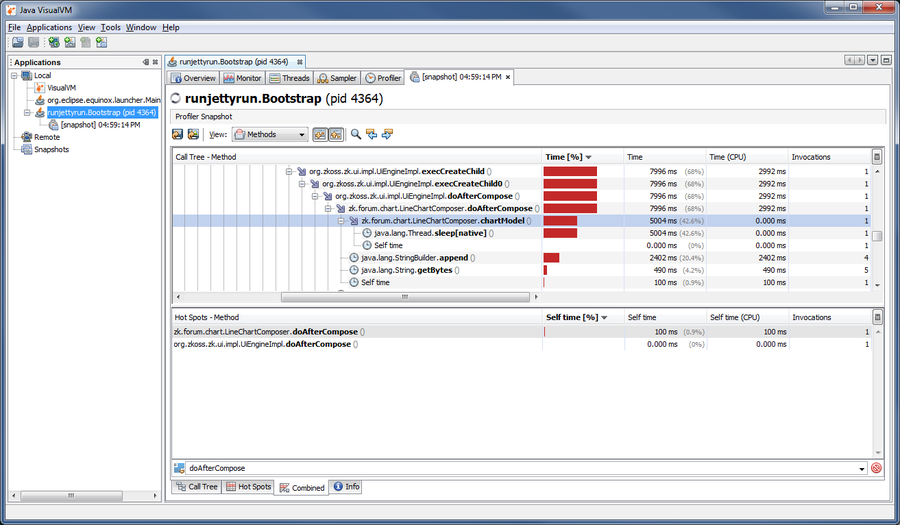
The 2 slow methods appear, then just take a snapshot, and view the details about the actual call strack in the combined view, and filter by the method name.
In the call tree we actually see what is happening inside in more detail.
the "chartModel()"-method is sleeping for 5 seconds, and the "doAfterCompose()"-method is performing time consuming String operations.
Performance issue located!
Memory Issue
http://books.zkoss.org/wiki/ZK_Configuration_Reference/zk.xml/The_listener_Element/The_org.zkoss.zk.ui.util.Monitor_interface
http://www.zkoss.org/javadoc/latest/zk/org/zkoss/zk/ui/util/Statistic.html
Add a listener to zk.xml <listener> <listener-class>org.zkoss.zk.ui.util.Statistic</listener-class> </listener>
Example of a small monitoring page:
<zk>
   <label multiline="true">
      Active Desktops: ${desktop.webApp.configuration.monitor.activeDesktopCount}
      Active Sessions: ${desktop.webApp.configuration.monitor.activeSessionCount}

      Total Desktops: ${desktop.webApp.configuration.monitor.totalDesktopCount}
      Total Sessions: ${desktop.webApp.configuration.monitor.totalSessionCount}
   </label>
</zk>
Access statistics in Java code:
 Statistic statistic = (Statistic) WebApps.getCurrent().getConfiguration().getMonitor();
 statistic.getActiveDesktopCount();
 statistic.getActiveSessionCount();
ZK Server Configuration
- check debug mode → zk config should not be enabled (disabled by default)
- check caching config → should not be disabled (enabled by default)
- http://books.zkoss.org/wiki/ZK_Configuration_Reference/zk.xml/The_Library_Properties/org.zkoss.web.classWebResource.cache
- http://books.zkoss.org/wiki/ZK_Configuration_Reference/zk.xml/The_Library_Properties/org.zkoss.zk.WPD.cache
- http://books.zkoss.org/wiki/ZK_Configuration_Reference/zk.xml/The_Library_Properties/org.zkoss.zk.WCS.cache
- check compression settings → should not be disabled (enabled by default)
- consider/check render on demand settings
- http://books.zkoss.org/wiki/ZK_Developer%27s_Reference/Performance_Tips/Client_Render_on_Demand
- http://books.zkoss.org/wiki/ZK_Developer%27s_Reference/Performance_Tips/Listbox,_Grid_and_Tree_for_Huge_Data/Turn_on_Render_on_Demand
- http://books.zkoss.org/wiki/ZK_Configuration_Reference/zk.xml/The_Library_Properties/org.zkoss.zul.client.rod
- http://books.zkoss.org/wiki/ZK_Configuration_Reference/zk.xml/The_Library_Properties/org.zkoss.zul.grid.initRodSize
- http://books.zkoss.org/wiki/ZK_Configuration_Reference/zk.xml/The_Library_Properties/org.zkoss.zul.listbox.initRodSize
- http://books.zkoss.org/wiki/ZK_Configuration_Reference/zk.xml/The_Library_Properties/org.zkoss.zul.tree.initRodSize (ZK 7)
- TODO ??? maybe more tweaks ???
- check http://books.zkoss.org/wiki/ZK_Developer%27s_Reference/Performance_Tips
Network Issue
If something in your network infrastrucure (routers, proxies, web servers...) is causing the performance issues, there is little you can do as web application developer.
Here some ideas to identify possible bottlenecks trying to reduce network complexity by:
- using ip addresses directly → indicates DNS problem
- avoiding proxies, routers, firewalls (e.g. access the application server from a browser on a remote desktop "closer" to the actual server)
- accessing the application server directly, instead of going through a webserver or load balancer
- disabling SSL and check difference
→ "Kindly" inform your network administrator about your observations and ask for help identifying, excluding, fixing these infrastructure problems.
