Manipulating Chart Model
Manipulating Model
Models are the perfect way for developers to interact with the charts as they shield developers from complexities that they need not know or interact with. In addition to this ZK model supports many design patterns including MVC[1] and MVVM[2], which are both fully supported patterns.
ZK provides chart model [3] to handle data in the chart. Manipulating chart model with charts is the same as other ZK components handling their supporting models. We've used MVC approach to create the chart in previous section - Create your first ZK Charts. In this section, we will create another example to manipulate chart model in MVVM approach.
We get started from creating an XYModel and put the data we want to handle:
ChartData.java
public class ChartData {

    static public XYModel getXYModel() {
        // Use the predefined implementation SimpleXYModel to create an model.
        XYModel model = new SimpleXYModel();

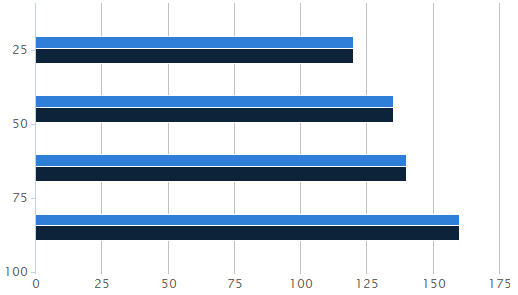
        model.addValue("2001", new Integer(20), new Integer(120));
        model.addValue("2001", new Integer(40), new Integer(135));
        model.addValue("2001", new Integer(60), new Integer(140));
        model.addValue("2001", new Integer(80), new Integer(160));

        model.addValue("2002", new Integer(30), new Integer(120));
        model.addValue("2002", new Integer(50), new Integer(135));
        model.addValue("2002", new Integer(70), new Integer(140));
        model.addValue("2002", new Integer(90), new Integer(160));

        return model;
    }
}
Declare a POJO VM as well as the property's getter method.
ChartVM.java
public class ChartVM {

    public XYModel getModel() {
        return ChartData.getXYModel();
    }
}
Reference the ViewModel in ZUL:
chart.zul
<window apply="org.zkoss.bind.BindComposer" viewModel="@id('vm') @init('ChartVM')">
    <charts type="bar" model="@bind(vm.model)" />
</window>
Enjoy the graphical presentation of data!
Supported Model
| CategoryModel or XYModel | |
| CategoryModel or XYModel | |
| CategoryModel or XYModel | |
| CategoryModel or XYModel | |
| XYZModel | |
| XYZModel | |
| CategoryModel or XYModel | |
| CategoryModel or XYModel | |
| SingleValueCategoryModel | |
| XYModel | |
| XYModel or XYZModel | |
| DialModel | |
| XYModel | |
| XYModel | |
| CategoryModel or XYModel | |
| SingleValueCategoryModel |
Examples of Chart using Charts Model
Pie Chart
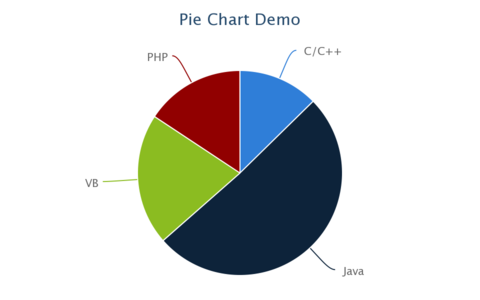
<div apply="demo.PieChartComposer">
	<charts id="chart" type="pie" width="480" height="300" title="Pie Chart Demo"/>
</div>
public class PieChartComposer extends SelectorComposer<Div> {
	@Wire
	Charts chart;

	public void doAfterCompose(Div comp) throws Exception {
		super.doAfterCompose(comp);

		PieModel model = new DefaultPieModel();
		model.setValue("C/C++", new Double(12.5));
		model.setValue("Java", new Double(50.2));
		model.setValue("VB", new Double(20.5));
		model.setValue("PHP", new Double(15.5));

		chart.setModel(model);
    }
}
Funnel Chart
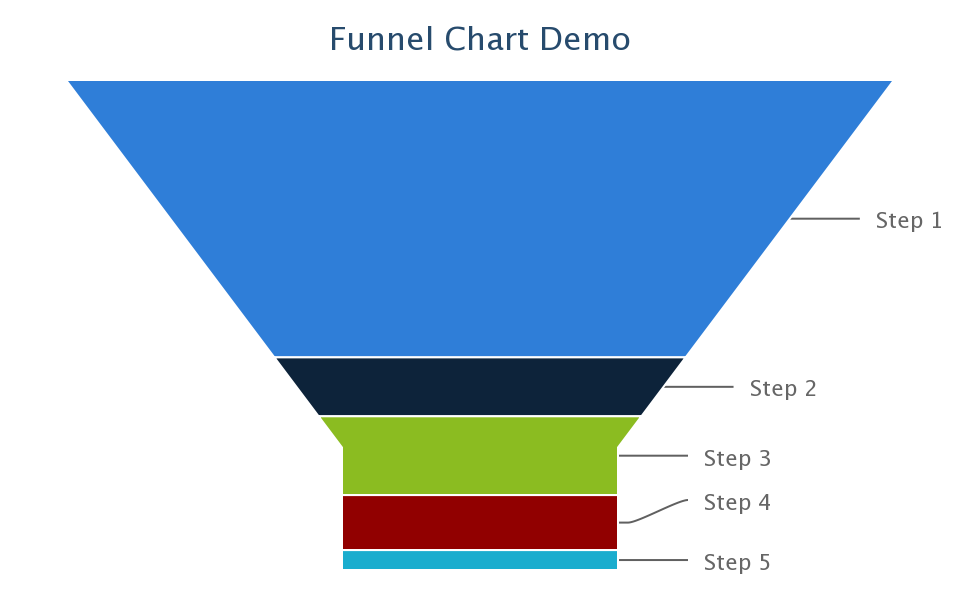
<div apply="demo.FunnelChartComposer">
	<charts id="chart" type="funnel" width="480" height="300" title="Funnel Chart Demo"/>
</div>
public class FunnelChartComposer extends SelectorComposer<Div> {
	@Wire
	Charts chart;

	public void doAfterCompose(Div comp) throws Exception {
		super.doAfterCompose(comp);

		SingleValueCategoryModel model = new DefaultSingleValueCategoryModel();
		model.setValue("Step 1", new Double(142.2));
		model.setValue("Step 2", new Double(30.2));
		model.setValue("Step 3", new Double(40.4));
		model.setValue("Step 4", new Double(28.2));
		model.setValue("Step 5", new Double(10.2));

		chart.setModel(model);

    }
}
References
< Get Complete Source Code of This Book >


