Changing Chart Configuration
ZK Charts provides a set of comprehensive API for chart initial configuration, you can change the configuration very easily by simply calling API. For example, if we want to change the title's configuration, we can call chart.getTitle() method to get the Title class then modify its attributes as below:
    // Get the title option of chart
    Title title = chart.getTitle();

    // Set some attributes
    title.setText("It's a title");
    title.setX(100);
    title.setY(250);
Of course you can also create a new Title class and assign it to chart:
    // Create a new Title
    Title title = new Title();

    // Set some attributes
    title.setText("Yet another title");
    title.setX(200);
    title.setY(400);

    // Assign title to chart
    chart.setTitle(title);
The API relation with Highcharts
Since ZK Charts is based on Hicharts, we design its API according to Highcharts options. ZK Charts has corresponding Java API (getter / setter) for most common Hightcharts option.
For example:
| Highcharts option | ZK Charts API |
|---|---|
| plotOptions.line.enableMouseTracking | chart.getPlotOptions().getLine().isEnableMouseTracking()
chart.getPlotOptions().getLine().setEnableMouseTracking(false) |
So you can look Highcharts option document first for an option's function then call the corresponding Java API.
Supported Version
Please remember to check which Highcharts version is available for the option.
File:Zkcharts-essentials-apiVersion.png
You can know the version of Highcharts bundled in ZK Charts by checking chart.wpd in a developer tool.
Use addExtraAttr() for Options without Setter
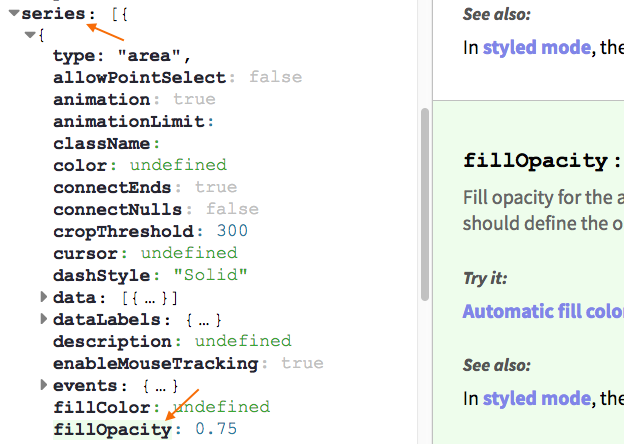
If you find there is an Highcharts option without a corresponding ZK Charts API, you still can set the option with addExtraAttr() method. For example there is an option series / fillOpacity without a setter available.
Thus, you can set it like:
public class OptionsWithouApiComposer extends SelectorComposer<Window> {

    @Wire
    Charts chart;
    private float opacity = 0.5f;

    public void doAfterCompose(Window comp) throws Exception {
        //omitted code

        chart.getSeries().addExtraAttr("fillOpacity", new AnyVal<Float>(opacity));
    }
}
Or chart.getPlotOptions().getColumnRange().addExtraAttr("grouping", new AnyVal<Boolean>(false));
< Get Complete Source Code of This Book >

