Real-time Performance Monitoring of Ajax Event Handlers
Lance Lu, Technology Evangelist, Potix Corporation
April 15th, 2010
Applicable to ZK 3.6 and later
Motivation
Given Ajax applications' event driven nature, it would be beneficial if developers could identify the time consuming event handlers and make the necessary performance tuning accordingly. Previous efforts, here and here, on ZK performance monitors have been made in the area of identifying the network latency, process time at server, and rendering time at client. In this article, we'll explore how ZK Gazer, an implementation of a ZK performance monitor, may reveal Ajax applications' bottlenecks in terms of event handling time in real time.
Technical Background
ZK's PerformanceMeter interface provides developers the utility to retrieve information with respect to each stage of an Ajax request-response cycle, including timestamps.
The PerformanceMeter method summary
- T1: requestStartAtClient (java.lang.String requestId, Execution exec, long time)
- T2: requestStartAtServer(java.lang.String requestId, Execution exec, long time)
- T3: requestCompleteAtServer(java.lang.String requestId, Execution exec, long time)
- T4: requestReceiveAtClient(java.lang.String requestId, Execution exec, long time)
- T5: requestCompleteAtClient(java.lang.String requestId, Execution exec, long time)
Developers could then work out the process time at server, rendering time at client, and the network latency:
- Server processing time = T3 - T2
- Client rendering time = T5 - T4
- Network latency = T4 - T1 - T3 + T2
However, to satisfy our need in obtaining the process time for each individual event handler, we need to implement ZK's EventInterceptor interface. With this convenient interface, we could insert instructions before and after each event, which is queued for processing at the server.
For our purposes, we'll need to implement the below methods:
- afterProcessEvent (Event event)
- beforeProcessEvent (Event event)
We'll set the current time at before, and after each event is processed and subtract the latter by the former to obtain the event handling time for the particular event:
- Ta = timestamp at afterProcessEvent
- Tb = timestamp at beforeProcessEvent
- Event handling time = Ta - Tb
Performance Monitor Design
We can approach the design of our performance monitor in two ways:
- a performance monitor that is deployed for testers (beta testing) or the public, which collects a great amount of data that is then processed as statistics for analysis
- a performance monitor that is deployed for the web app developer (alpha testing) to learn, in real time, the performance of specific event handlers
For ZK Gazer, we'll focus on the latter for now.
The UI elements are:
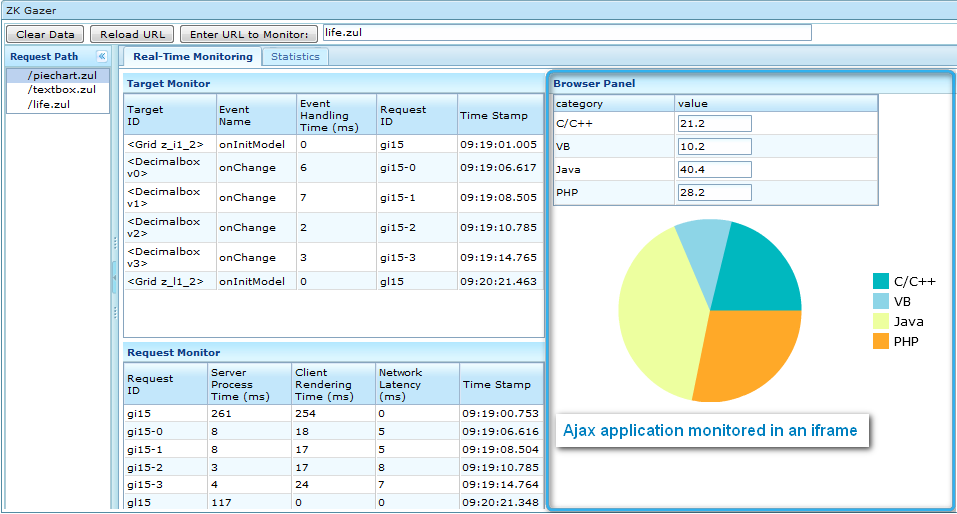
- Enter URL to Monitor (button + textbox) : Users enter the ZUL file path here, enter the text either by pressing "Enter" key, or pressing the button.
- Clear Data button: Clears all performance data in memory
- Reload URL button: Refreshes the iframe in Browser Panel
- Real-Time Monitoring Tab : Contains the Target Monitor, Request Monitor, and Browser Panel.
- Browser Panel : Houses an iframe which acts as a browser for users to interact with a ZK application under monitoring. The benefit of this is getting rid of the need to switch between different browsers (one for the performance monitor interface, others for the Ajax apps being monitored)
- Target Monitor : Shows information on events and their target component in real-time as the application under monitoring is being tested
- Request Monitor: Shows information on each ZK asynchronous update request in real-time as the application under monitoring is being tested
- Request Path explorer: Click on a request path shown to switch to the iframe and data associated with that request path.
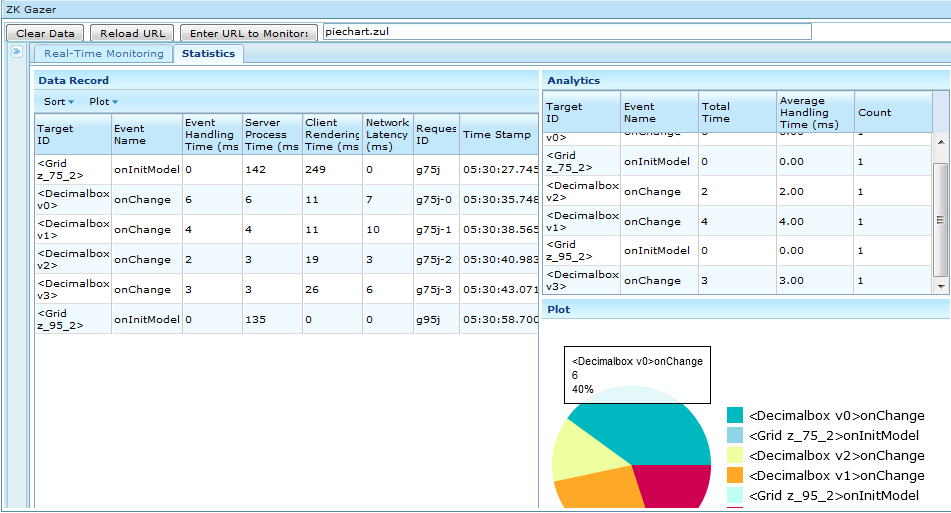
- Statistics Tab : Contains the Data Record grid, Analytics grid, and Plot
- Data Record Panel : Shows a log of all data collected
- Sort Menu :Click and select a sorting function to display the data record in more meaningful format
- Analytics Panel: Shows the event handling time with respect to each target component
- Plot Panel : Shows the average event handling time for each target component in a pie chart
Performance Monitor Implementation
- Register listeners for PerformanceMeter and EventInterceptor interfaces
<?xml version="1.0" encoding="UTF-8"?>
<zk>
	<listener>
		<description>Monitor the statistic</description>
		<listener-class>org.zkoss.zk.ui.util.Statistic</listener-class>
	</listener>
	<listener>
              <description>ZK performance monitor</description>
              <listener-class>org.zkoss.zkdemo.monitor.PerformanceMeter</listener-class>
	</listener>
        <listener>
              <description>ZK AuInfoInterceptor</description>
               <listener-class>org.zkoss.poc.gazer.ctrl.AuInfoInterceptor</listener-class>
        </listener>
</zk>
- Write a class that implements the PerformanceMeter interface
- Get the request ID, Execution, and time from each stage of a ZK AU request cycle
- request ID = an automatically assigned string to identify a ZK AU request
- Execution = org.zkoss.zk.ui.Execution, a wrapper for the AU request. The request is served through this wrapper
- time = epoch time in milliseconds
public void requestStartAtServer(String requestId, Execution exec, long time) {
    ...
    ReqDataCarrier carrier = ...;
    carrier.setTime(1, time);
    carrier.setExecId(exec.toString());
    carrier.setReqPath(getCurrentReqPath());
    ...
}
- Write an implementation for the EventInterceptor interface
- Set timestamps before and after processing the incoming event, for example:
 public Event beforeProcessEvent(Event event) {
      ...
      EventInfo eventInfo = createEventInfoInst( event);
      eventInfo.setStartProcTime(System.currentTimeMillis());
      ...
}


public void afterProcessEvent(Event event) {
       ...
       EventInfo eventInfo = getEventInfoInst();
       eventInfo.setAfterProcTime(System.currentTimeMillis());
       getDataCarrier().addEventInfo(eventInfo);
        ...
}
- Note the last line getDataCarrier().addEventInfo(eventInfo) appends EventInfo to its corresponding asynchronous request data object
A Proof of Concept Walkthrough
In this section, we'll look at how ZK Gazer reveals the bottleneck of a small demo application that accesses database(HSQLDB) and renders data in grid.
Set up
- Download ZK Gazer from Download from Google code (ZK 5 version) or ZK Gazer from Github (ZK 6 version), the necessary Java source code is included in org.zkoss.poc.gazer.demo and the ZUL file life.zul is contained in the WebContent folder.
- Find the hsqldb folder on Google code, copy and paste it to your local C:
Demo Program Implementation
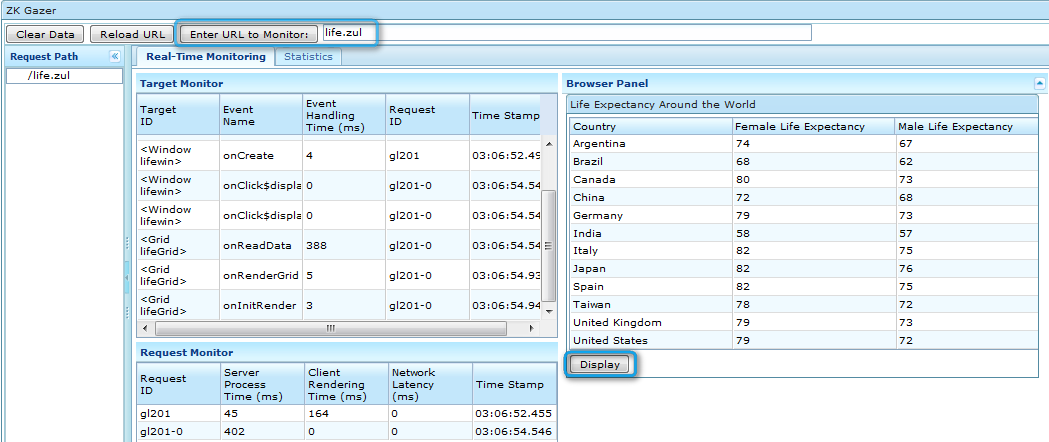
The demo app displays the average life expectancy of citizens around the world upon the click of the "Display" button. For illustration purposes, this simple action is divided into 3 events:
- onClick$display -- the "Display" button's onClick event
- onReadData -- the event in which the database is accessed and read
- onRenderGrid -- the event in which data is rendered in a grid
Operating and Analyzing Results on ZK Gazer
- Enter "life.zul" in the URL text box and click on the "Display" button
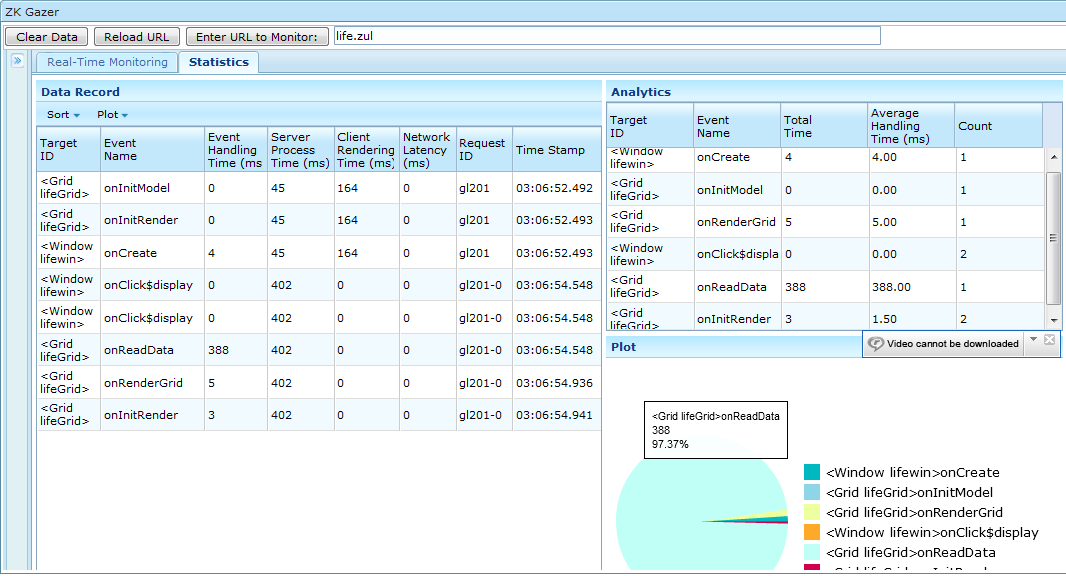
- Notice the event handling time for the events we engineered into this demo. As expected, onReadData took significantly more time, followed by onRenderGrid, and lastly, the simple onClick event that triggers the other events.
- Select on the "Statistics Tab" and view the "Data Record" and "Analytics" grids to view the statistics. We could use the click and choose a sort function to display the data record in a better format. The Flash plot gives an overview of the average event handling time for each event; however the cursor over the chart to get the percentage associated with each event.
Conclusion
In this Small Talk, we looked into how an EventInterceptor implementation could work in conjuction with PerformanceMeter utility to determine the event handling time for Ajax requests. The performance bottlenecks are better determined when we could monitor performance at an event handling level.
Download ZK Gazer
- Download from Google Code
Comments
| Copyright © Potix Corporation. This article is licensed under GNU Free Documentation License. |


